What is Time to First Byte (TTFB)?
TTFB stands for time to first byte. It is a time metric that determines the time it takes for the first byte of a server response to arrive when some request for a resource is made.
A perfect example of time to first byte could be where a person wants to view the homepage of a WordPress site. Now, a resource request is made to the WP backend server to load the site’s homepage, and the server returns the first byte to the browser after some time; let’s assume 2 seconds. This time between the browser’s request for content and receiving the first byte back from the server is known as ttfb and is also referred to as first-byte time since both mean the same.
TTFB components
The process of TTFB consists of three major request phases mentioned below:
- HTTP Request Time
- Process Request Time
- HTTP Response Time
1. HTTP Request Time refers to the time it takes for a user’s request from the browser to reach the server. For example, let’s say you own a blog site, and a visitor opens up your site. Now, the visitor’s browser will send an HTTP request to your server. The time for this request to reach the server will be the HTTP Request time. Multiple factors could slow down this phase, including slow DNS (Domain Name Server) lookup, visitor’s internet speed connection, the physical distance between your server location and the visitor’s browser location, etc.
2. Process Request Time refers to the time to process the request and generate a response once it’s received on the server side. Taking the same example, you can say that now the request from your visitor’s browser to view your blog page has reached the server, and the server is processing the request so that it starts returning you a response as a first byte. This phase might get slowed down due to slow database calls, excessive scripts being executed on the server, insufficient server resources, etc.
3. HTTP Response Time refers to the time it takes for the first byte of response data to reach the browser from the server after it is processed. Considering the same example, you can say that now your server is sending your visitor’s browser the first byte of response data. A significant bottleneck that might slow down this phase might be the poor network speed of both the server and the client.
What is a good TTFB score?
A TTFB score is a score or a rating to evaluate the results of our TTFB. We can categorize these scores into three categories (poor, average, and good)—the lesser the ttfb, the better the score category.
- Poor – 600 ms (0.6 seconds) or above.
- Average – between 200 ms (0.2 seconds) and 500 ms (0.5 seconds).
- Good – anything less than 200 ms (0.2 seconds).
How to measure it?
Techniques to measure time to first byte can be categorized into three major categories (Field tools, Lab tools, and Measure in JavaScript). Each of them is explained in detail below.
1. Field Tools
Field tools measure the results captured from real-time user activity. Two field tools are particularly known for measuring TTFB, which are mentioned below:
- Chrome user experience report. It provides you with real-time user experience data tested on opted-in users. It measures the same core web vitals metrics as any lab tools will give you, including first contentful paint (FCP), largest contentful pain (LCP), time to first byte (TTFB), etc. Still, it is different because it gives you real-time user experience(s) instead of just lab results.
- Web-vitals is a very lightweight, modular JavaScript library for measuring all essential core web vitals on real-time users. It is a client library that can easily be downloaded via npm (node package manager) or via yarn (yet another resource locator). You can determine TTFB on the browser using this easy-to-use and efficient JavaScript library, which tests real-time user activity.
2. Lab Tools
Unlike field tools, lab tools generally measure website metrics without any real-time user interaction. Some of the particularly known lab tools for measuring time to first byte include:
- Chrome dev tools
It is one of the most common ways to measure core web vitals or TTFB. The only prerequisite requirement for using this is you must be a chrome user. You don’t need to rely on any third-party tool while using this method and can directly test ttfb.On your browser, you can open up the chrome dev tools by pressing the F12 key or right-clicking on the page and selecting inspect at the very bottom of the tool option. Once the dev tools are open, check for the Network tab, which should be between the Sources and Performance tab.It will show you a waterfall column showing the requests made. Select the item you want to inspect, and you will find Waiting (TTFB) in the Request/Response section.
Note: The test results you get may not be what your site visitor might experience because your specific network conditions and network latency can influence TTFB.
- WebPageTest
It is a smart and easy-to-use online website analytics tool that is ideal if you want to test the speed of your website quickly. You can also have a detailed report that covers primary core web vital metrics, including TTFB.Usage is pretty simple. Just visit the tool, paste or enter your website’s URL in the text field and then click on the Start Test button to start the test.Once the test evaluation process completes, it will show you a results page rich in information and details about various metrics. There is also a score for TTFB over there, which helps you determine the TTFB for your website and make relevant decisions accordingly. Overall, this tool is amazing and provides you with all the required website metrics.
- GTmetrix
It works the same as WebPageTest with a website URL field at the start and a results page showing different matric results at the end. - KeyCDN
It is, again, a very efficient tool that functions in the same way as WebPageTest and GTmetrix.
3. Measure in JavaScript
If you’re a developer who likes to use code vs. tools, even for analytics, this option is a great fit for you. You can measure TTFB using some JavaScript code.
To measure the TTFB of navigation requests in the browser, we can use the Navigation Timing API (an API that provides data used to measure a website’s performance).
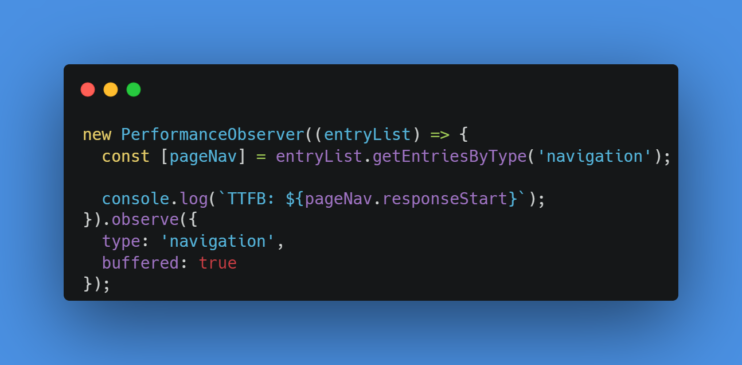
Let’s create a PerformanceObserver that listens for a navigation entry, and then we can log the results to the console.

new PerformanceObserver((entryList) => {
  const [pageNav] = entryList.getEntriesByType('navigation');

  console.log(`TTFB: ${pageNav.responseStart}`);

}). observe({
type:'navigation',
buffered: true
});
There is just one drawback of using PerformanceObserver, which is that not all browsers support it. To ensure maximum browser support, the web-vitals JavaScript package comes in handy.
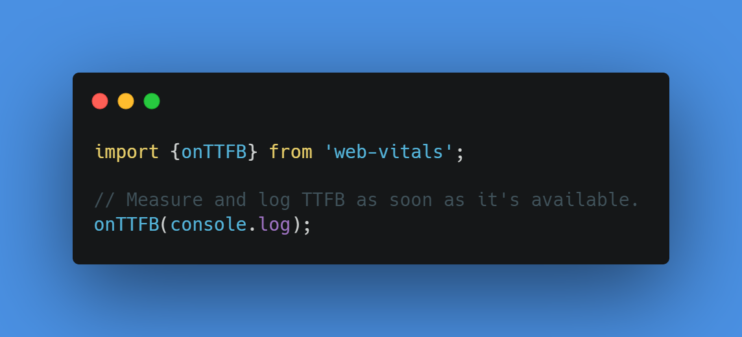
A basic example of using the web-vitals library to measure TTFB is demonstrable by the following code snippet, where you can see within just 2-3 lines of basic code; we can quickly determine the TTFB of our website.

import {onTTFB} from 'web-vitals';
// Measure and log TTFB as soon as it's available.
onTTFB( console.log);


