

What is vizGPT?
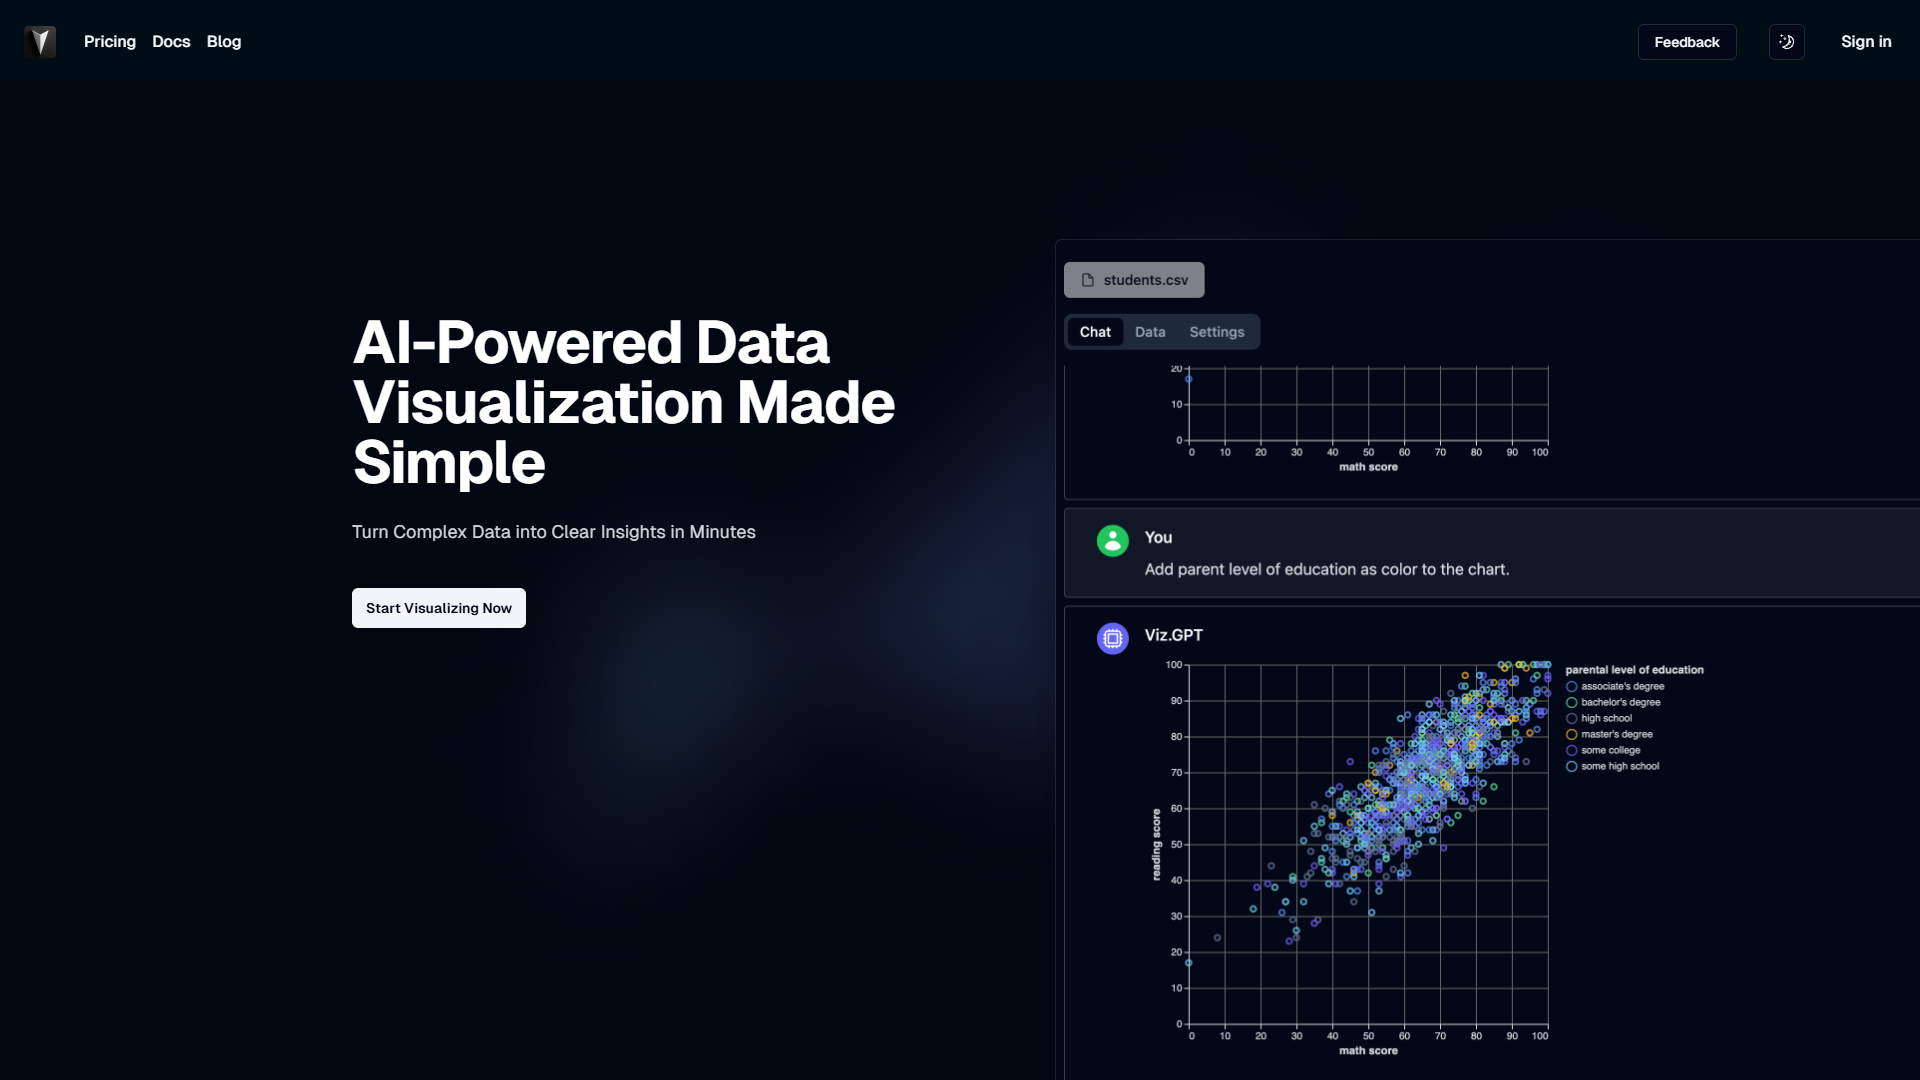
vizGPT is a cutting-edge data visualization tool that utilizes AI, specifically GPT-4, to transform raw data into comprehensive charts and graphs. It's designed to make data analysis more intuitive and accessible for professionals across various fields by offering advanced visualization capabilities.
What are the key features of vizGPT?
The key features of vizGPT include advanced data visualization, unlimited data sources for comprehensive analysis, priority AI processing for quick results, and premium user support to assist with any technical queries or issues.
Is there an enterprise plan available for vizGPT?
Yes, vizGPT offers an enterprise plan that includes custom visualization development, dedicated support, and advanced security compliance. This plan is tailored to meet specific organizational needs and comes with custom pricing based on requirements.
Can vizGPT integrate with other data sources?
Yes, vizGPT supports integration with a variety of data sources, enabling users to input data from multiple streams seamlessly. This feature allows for comprehensive data analysis, making it easier to visualize and draw insights from complex, multi-source datasets.
Does vizGPT offer a free plan?
Currently, vizGPT does not offer a free plan. However, users can benefit from a 7-day free trial on its paid plans, allowing them to explore the tool's functionalities and assess its suitability for their analysis needs.
Who can benefit from using vizGPT?
vizGPT is best suited for professionals and enterprises that need to analyze and present data efficiently. It's ideal for those looking for a tool that offers advanced visualization capabilities, custom visualization options, and high-security compliance for data processing.
How does vizGPT ensure data security?
vizGPT adheres to high-security compliance standards, incorporating advanced security measures to protect data. This ensures that any data visualization and interaction with the tool maintain secure and compliant practices, safeguarding user information.
How can users get support from the vizGPT team?
Users can receive premium support from the vizGPT team via various channels to ensure efficient issue resolution. The support team helps users troubleshoot problems, maximize their use of the tool's features, and gain the most from their data visualization experiences.