What is PageSpeed Insights?
PageSpeed Insights (PSI) is an analytics tool offered by Google that evaluates website performance across desktop and mobile devices. Each URL’s Google PageSpeed score is a reference value calculated from the metrics used for search engine optimization (SEO).
Google first introduced page load speed as a ranking factor for their search algorithms in 2010. This was supplemented in 2018 to extend to mobile search results. In 2021, the Page Experience Update established Core Web Vitals as a key ranking metric for search engine results. PSI implements the Lighthouse framework for calculating Google PageSpeed scores.
What does PageSpeed Insights do?
PageSpeed Insights allows publishers to view their website’s desktop and mobile performance through an online interface or by using Chrome DevTools. Lighthouse for URL analysis can also be run using the command line or a Node.js API. Developers can view the performance of each webpage and receive feedback for improvement.
The Core Web Vitals metrics are based on three main metrics: Largest Contentful Paint (LCP), First Input Delay (FID), and Cumulative Layout Shift (CLS). These values measure any URL’s responsiveness, stability, and page load speeds. Websites that score higher on these metrics will usually receive better rankings on Google’s search engine results pages.
Understanding PageSpeed Insights
PageSpeed Insights helps you analyze how fast your website loads and recommends improving it. Improving your website speed can enhance user experience and rank on search engines.
Essentials of website speed
Website speed is crucial for visitor engagement. When your pages load quickly, users are more likely to stay and interact with your content.
PageSpeed Insights measures both lab data and field data.
Lab data is collected in a controlled environment. It helps in debugging performance issues.
Field data comes from real-world users and shows how your site performs in the actual world.
PageSpeed Insights scores your site from 0 to 100. Higher scores indicate better performance. The tool provides specific suggestions, such as optimizing images, reducing server response time, and leveraging browser caching.
How important is a PageSpeed score for SEO?
Search Engine Optimization (SEO) is about increasing your site’s visibility on search engines like Google. Page speed is an important ranking factor in Google’s algorithm. Faster pages contribute to a better user experience, leading to lower bounce rates and higher engagement.
When your site loads quickly, visitors spend more time on it, which can boost your position in search result pages (SERPs).
Following PageSpeed Insights’ optimization suggestions can make your site load faster, potentially improving user satisfaction and SEO rankings.
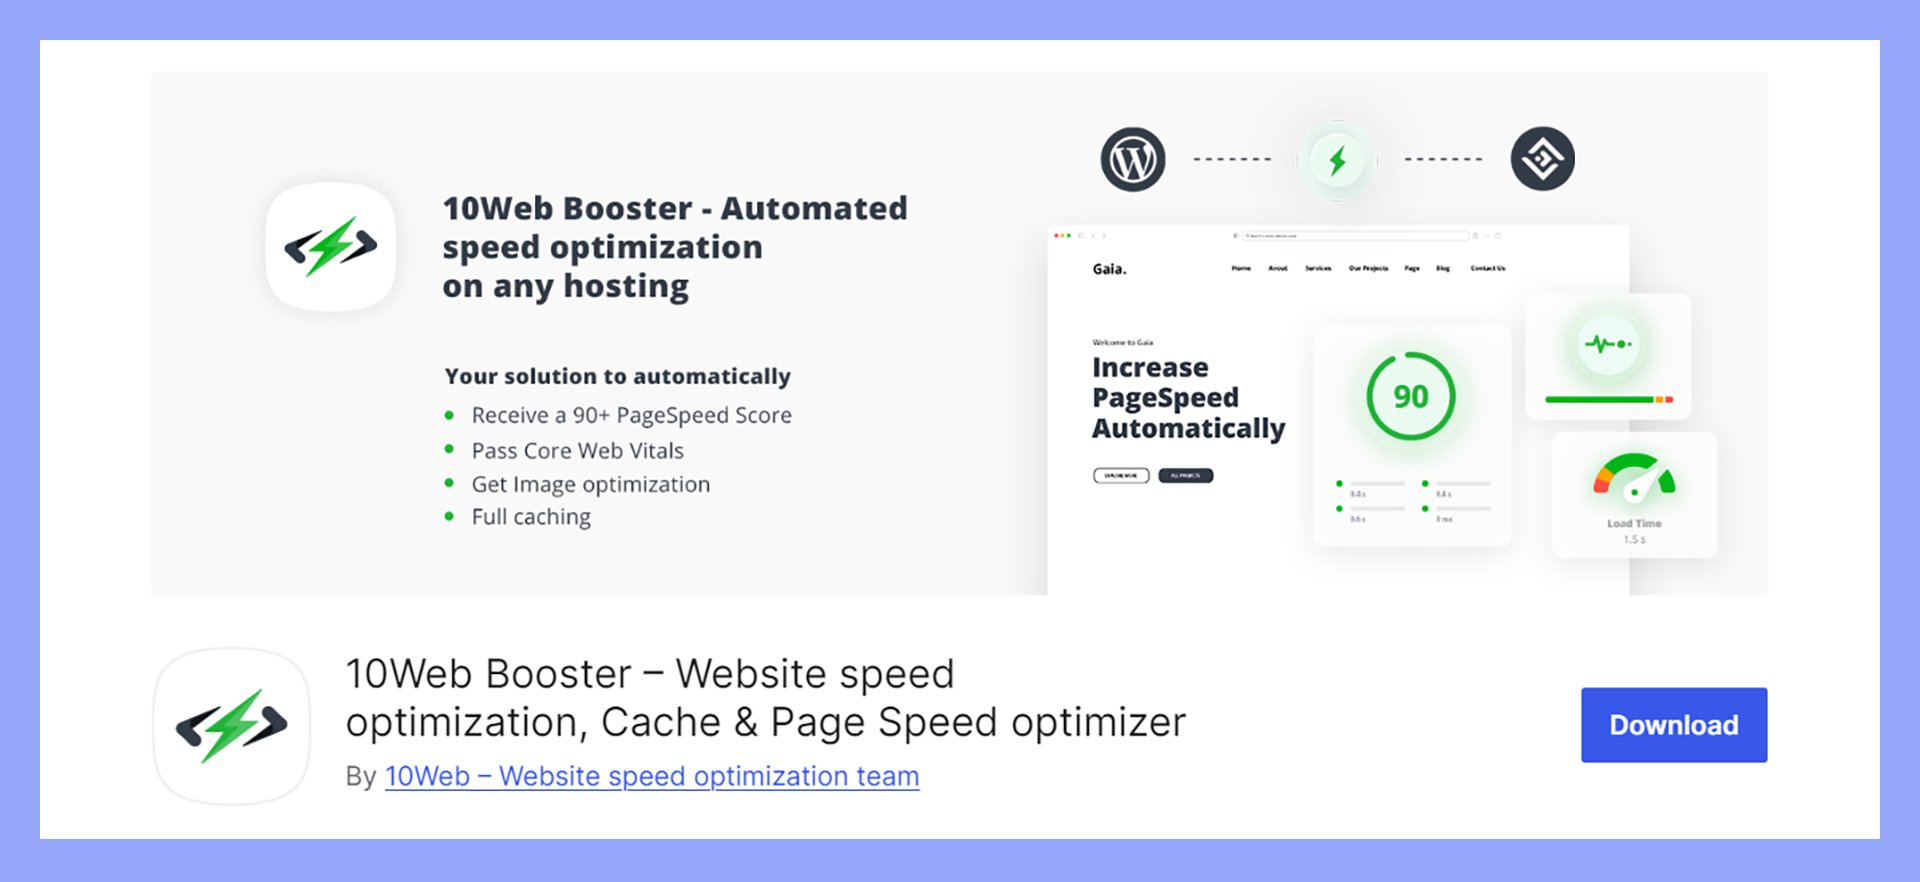
The 10Web Booster is a powerful SEO tool for web publishers that optimizes any website’s performance to get a higher Google PageSpeed score and automatically pass the Core Web Vitals assessment. Implementing solutions for CSS/HTML compression, JavaScript minification, and image lazy loading can help your domains receive a 90+ PageSpeed score.
How does PageSpeed Insights work?
Google’s PageSpeed Insights currently runs on the open-source Lighthouse framework, which measures a domain’s performance information and generates feedback for the user on improving desktop/mobile displays. This data is provided to publishers so websites can be transparently optimized for SERPs on fixed benchmarks to improve rankings.
Google algorithms will rely on the field data collected by Chrome User Experience Reports over time to calculate search engine results. The PageSpeed Insights service allows publishers to see what users experience when loading their web pages on different devices. By analyzing the page load times for desktop and mobile, publishers can fix errors, optimize script performance, and implement web server solutions that boost user experience.
A high PageSpeed score is necessary for a web page to rank highly in the Google search results pages. PageSpeed Insights removes the mystery from the ranking process by exposing the variables used by the search algorithm. This allows publishers to optimize their scripts for performance through caching, compression, minification, lazyload, and other tactics.
Core Web Vitals and performance metrics
PageSpeed Insights (PSI) uses various metrics to assess speed and user experience, focusing on Core Web Vitals like LCP, FID, and CLS.
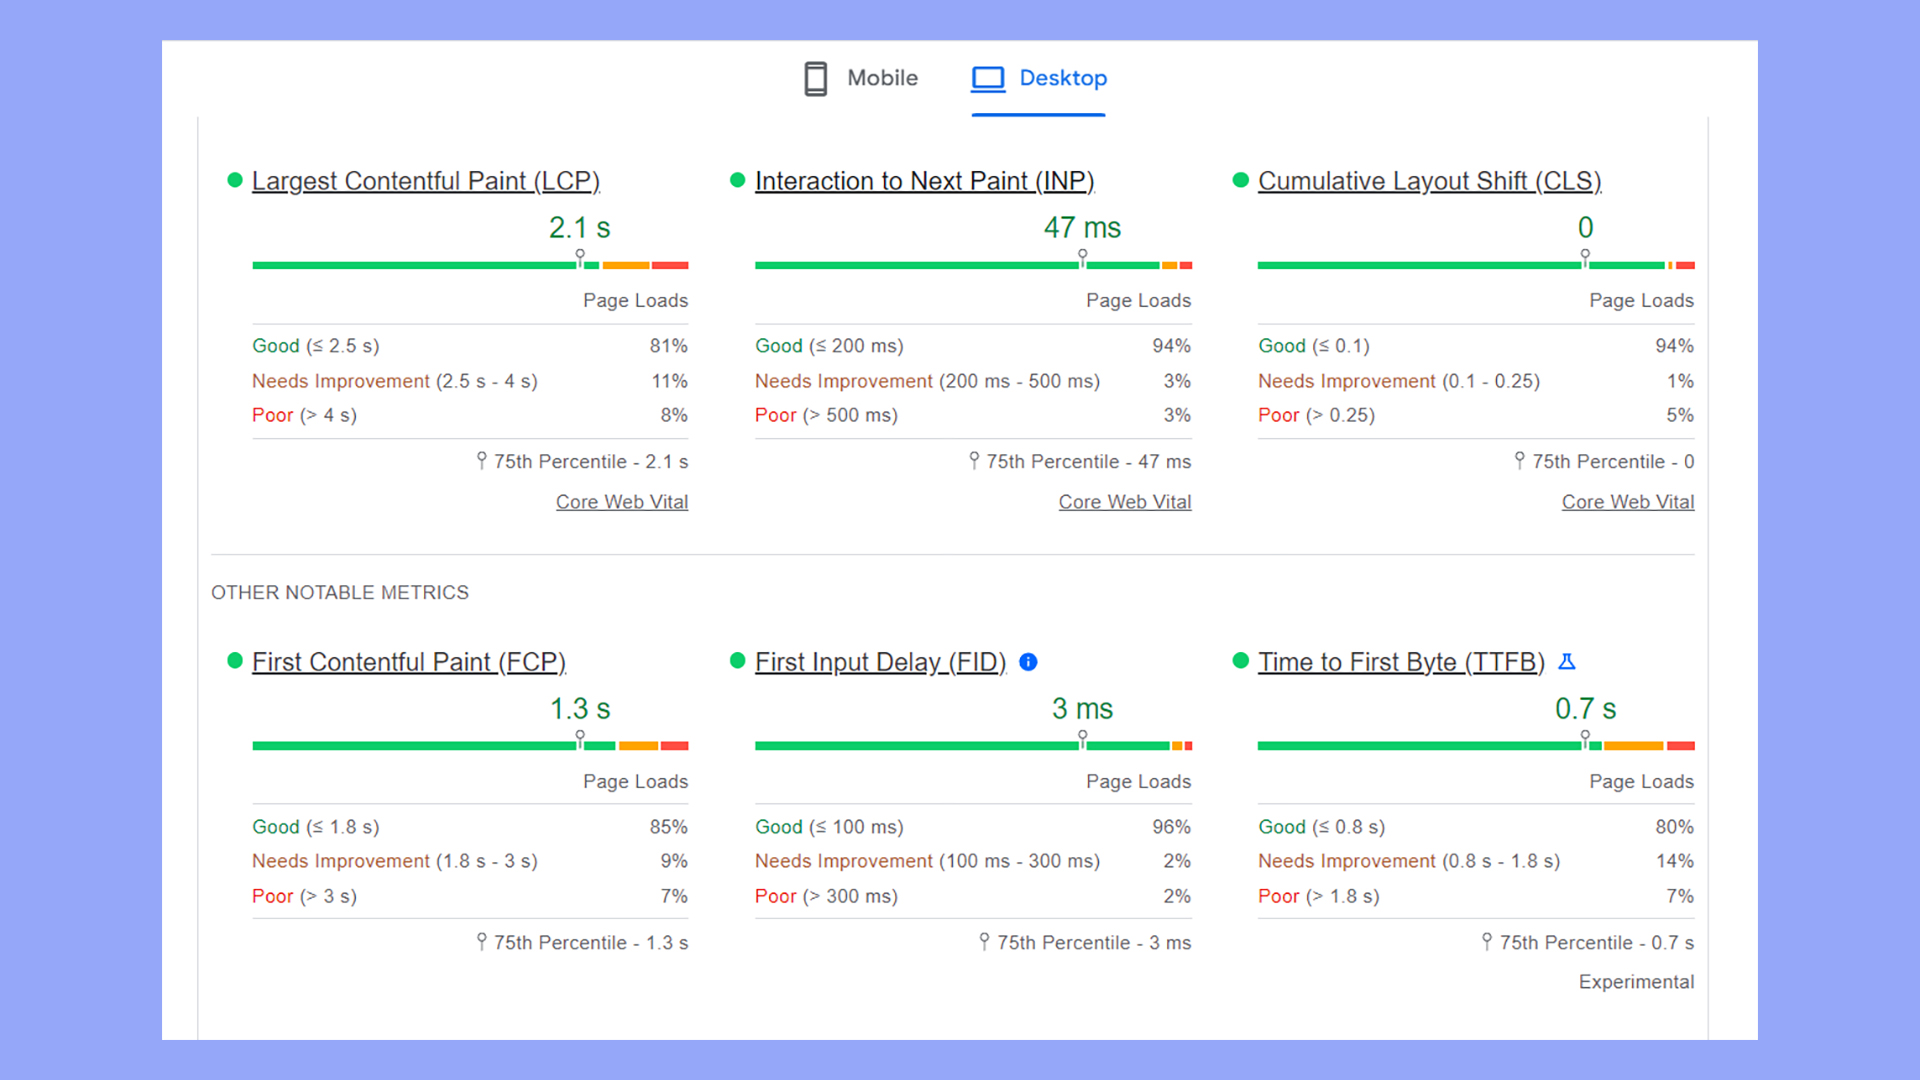
In contrast to Lighthouse, which tests each URL individually for page load speed elements, Google generates the Core Web Vitals report using user data reports. Google charts the use of field data over 28 days for the purposes of search engine ranking by an algorithm.
The Core Web Vitals score includes results by status, metric type, and groups of similar web pages. If the web page is not indexed by Google, the score is not generated. The score collates the results of the three metrics: LCP, FID, and CLS.
Each part of the analytics receives a score of “good,” “needs improvement,” or “poor,” as well as suggestions for optimization in the Opportunities recommendations. The Performance score represents a weighted average of the metric results assessed by the Lighthouse framework.
How PageSpeed Insights calculates scores
The raw metrics values collected by PSI are converted into a 0-100 ratio based on comparison to an archive of HTTP(S) sites. Lighthouse Performance scores fluctuate over time.
The calculation of the Google PageSpeed score includes multiple factors like Total Blocking Time (TBT), Largest Contentful Paint (LCP), and Cumulative Layout Shift (CLS). These factors contribute 30%, 25%, and 15% to the final PageSpeed score, respectively.
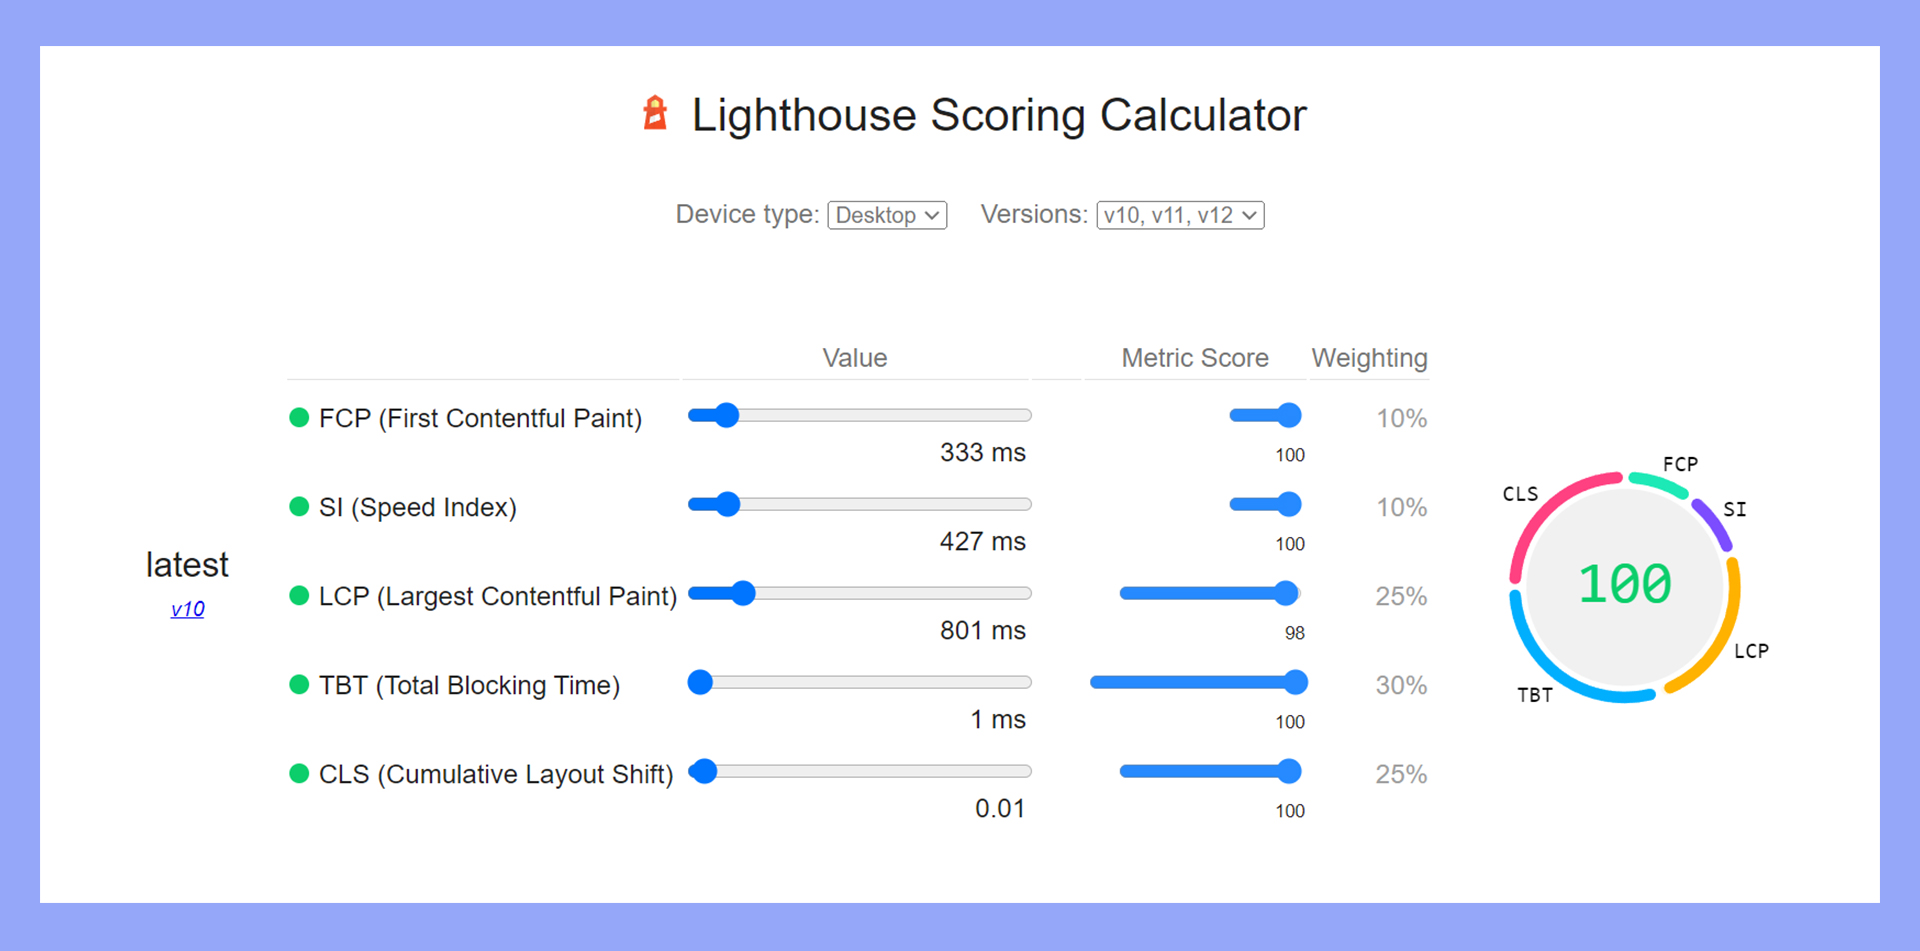
Other factors measured in the calculation are First Contentful Paint (FCP), Time to Interactive (TTI), and the Speed Index (SI). These factors each contribute 10% of the total PSI score.
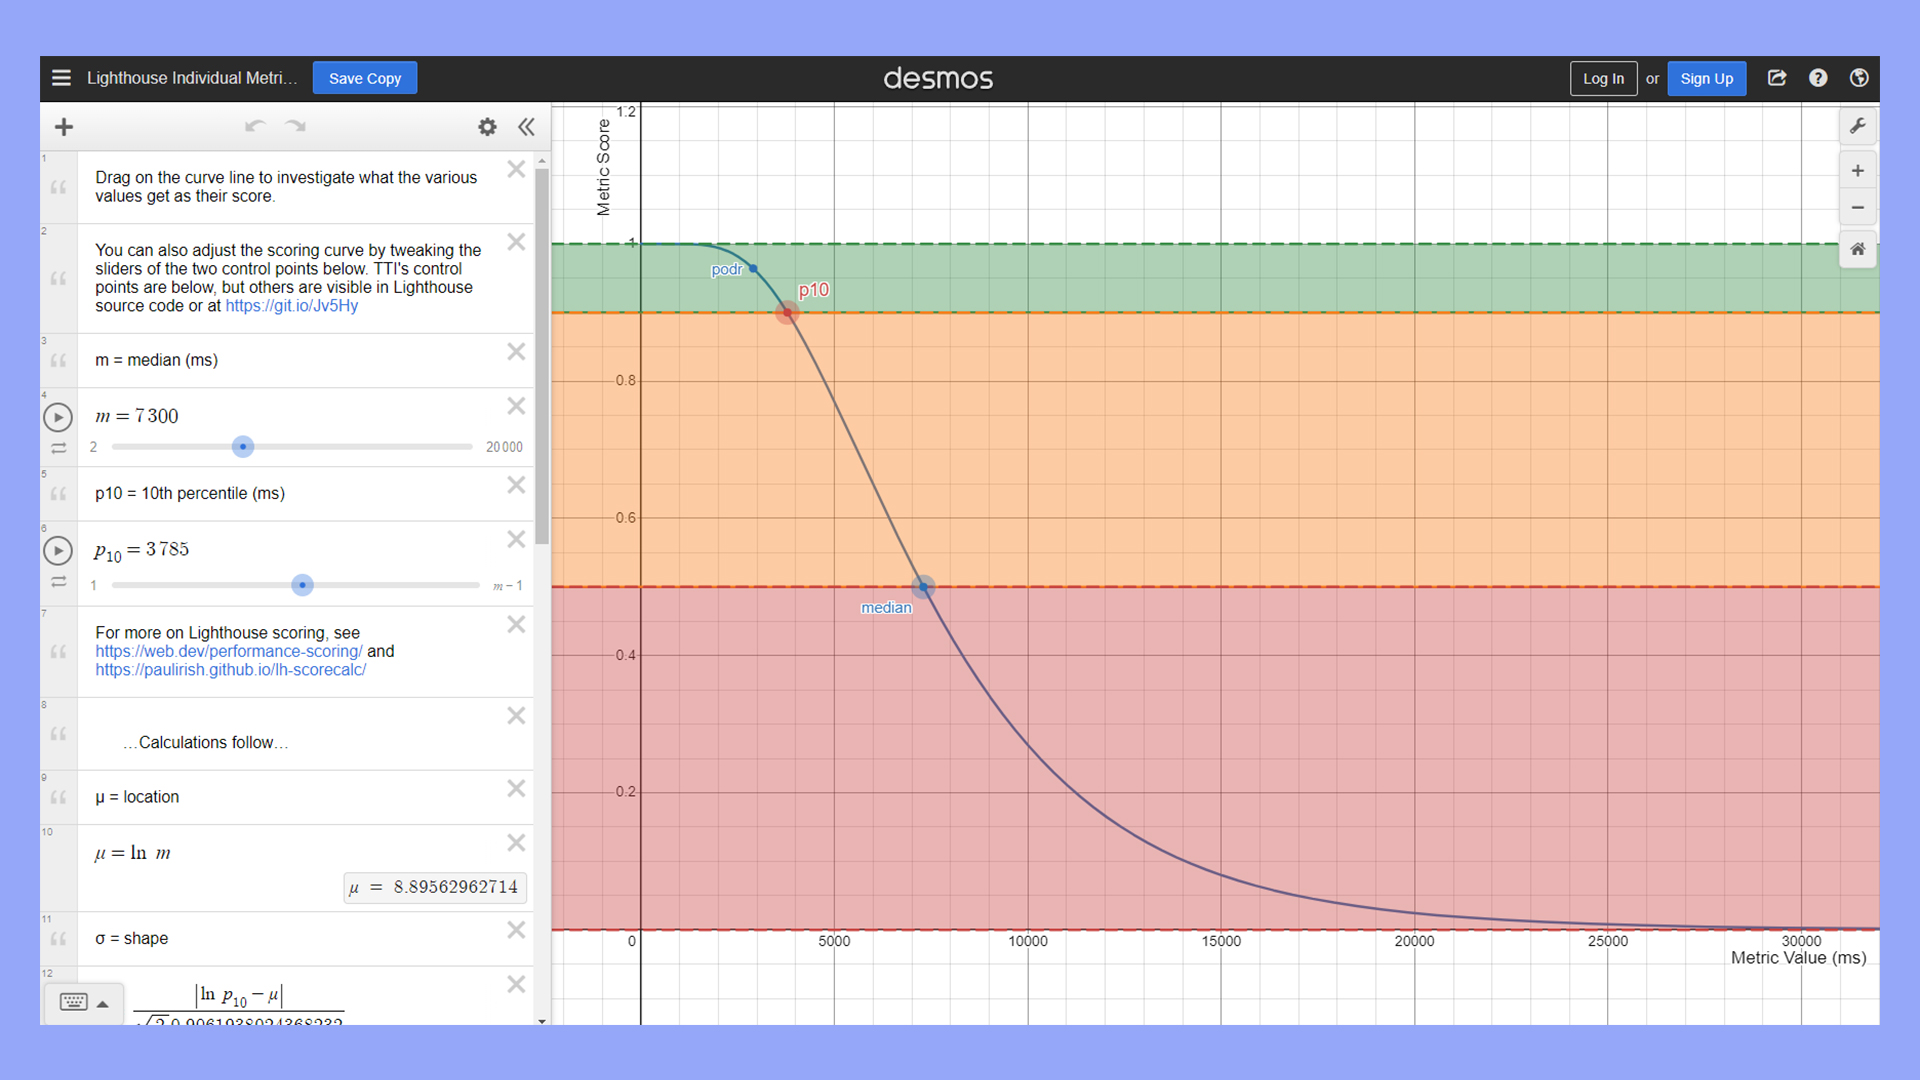
Lighthouse calculates the Speed Index (SI) score using the Speedline Node.js module developed by WebpageTest.org. The Speedline module measures a website’s visual progress in histograms to determine how fast the content is rendered across the user experience.

PageSpeed vs. page loading time
Benchmarks like the Speed Index (SI), First Contentful Paint (FCP), and Time to Interactive (TTI) measure the viewable area of the content pane from the time that rendering begins until it is visually complete. Thus, the PageSpeed score differs from a URL’s total load time.
Each of these benchmarks offers unique insights into different aspects of page performance.
Largest Contentful Paint (LCP)
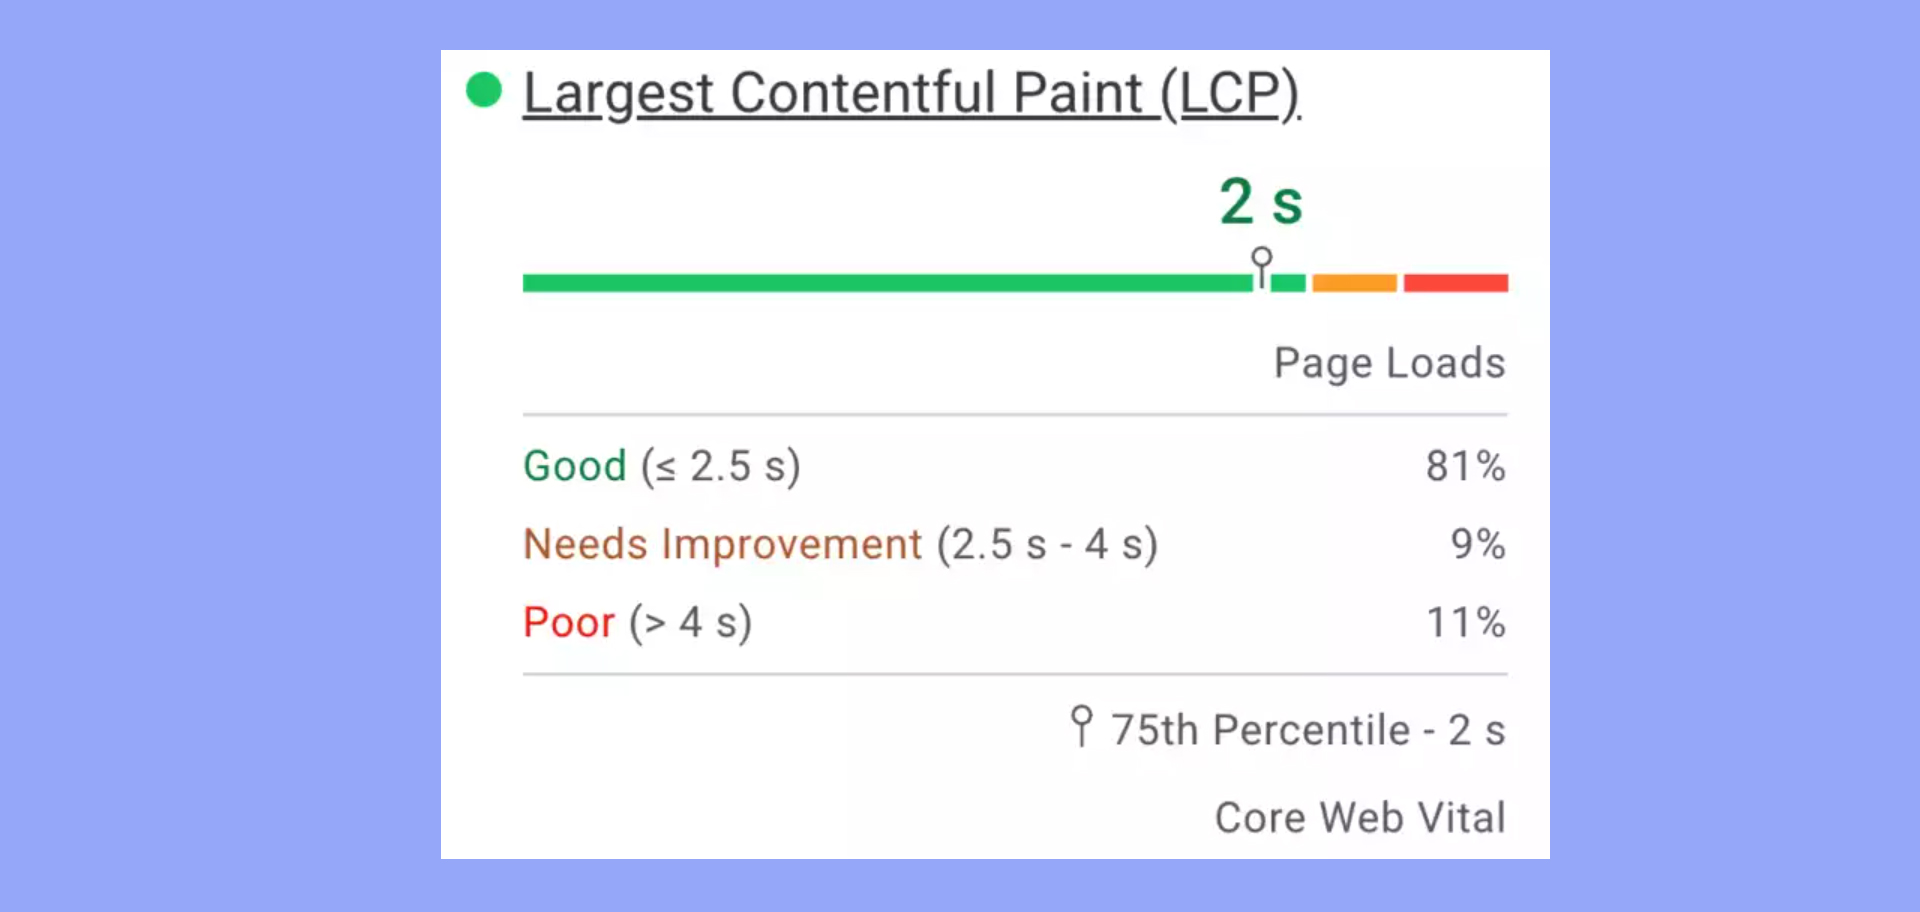
Largest Contentful Paint (LCP) gauges the time it takes for the largest content element to be fully visible. This is crucial for user satisfaction because it signifies that the main part of the page has loaded. The Largest Contentful Paint (LCP) variable is among the most important in the Core Web Vitals reports.
The ideal LCP is within 2.5 seconds. Longer times can frustrate users and lower engagement rates.
Large images, videos, and block-level text are elements that usually contribute to LCP. Optimizing these elements can drastically improve LCP times.
First Contentful Paint (FCP)
First Contentful Paint (FCP) measures the time it takes for the first piece of content to appear on the screen. This could be text, an image, or a non-white canvas element. FCP is important because it gives users an initial indicator that the page is loading.
For a good user experience, aim for an FCP of under 1.8 seconds. Anything longer can make users feel like the page is sluggish.
Monitoring FCP can help you identify bottlenecks in the loading process and improve initial load times.
First Input Delay (FID)
First Input Delay (FID) measures the time from when a user first interacts with your page (like clicking a button or link) to the moment the browser starts processing that interaction. FID is crucial for interactive content because it directly affects how users perceive your page’s responsiveness.
For a good experience, aim for an FID of less than 100 milliseconds. Higher delays can make your site feel unresponsive.
You can improve FID by minimizing JavaScript execution times and ensuring that your main thread isn’t blocked.
Cumulative Layout Shift (CLS)
Cumulative Layout Shift (CLS) tracks a page’s visual stability. It measures all unexpected layout shifts that occur throughout the page’s lifespan.
High CLS scores indicate poor user experience due to content jumping around on the screen.
A good CLS score is less than 0.1. Avoiding abrupt layout shifts can involve setting size attributes for images and ads, and being careful with dynamic content injection.
Improving CLS helps in creating a more stable and pleasant browsing experience.
Speed Index
Speed Index measures how quickly the content of a page is visibly populated. It looks at the visual progress of page loading and calculates an average time for all the parts of the content to become visible.
A lower Speed Index is better for a smooth user experience. It provides an overview of how quickly users can see usable content, making it a valuable metric for assessing overall page speed.
The Speed Index is unique in that it analyzes page loads using a video recording. Each frame of the video is converted into a histogram that charts the visual rendering of page elements over time. The Speed Index includes two main variables: Start Render and Visually Complete.
The use of lazy loading on images, HTML/CSS compression, and server optimization can improve these scores. For Google, less than 3.4 seconds per page is “fast,” and over 5.8 seconds is “slow.” The PSI Performance report includes a list of optimizations that can be implemented.
Optimizing above-the-fold content can significantly improve your Speed Index.
First Meaningful Paint (FMP)
Lighthouse tracks the First Meaningful Paint data in PSI. It represents the time required to load the visible page elements to the user from the first request. The FMP value represents only “above-the-fold” content that is viewable in the user’s browser.
For Google PageSpeed score calculation, less than 2 seconds for the First Meaningful Paint (FMP) value is rated as “good,” and render times over 4 seconds are rated as “poor.”
First CPU Idle
The First CPU Idle variable measures the time it takes for the page elements to become minimally interactive. This includes most but not all of the UI elements. According to Google, the page must be able to respond to the majority of user requests in a reasonably functional manner.
Google has depreciated this variable in favor of Time To Interactive (TTI). Rates under 4.7 seconds are marked as “fast,” while results over 6.5 seconds are considered “slow.”
Time to Interactive (TTI)
Time to Interactive (TTI) is measured by lab data in Lighthouse to represent the complete loading of UI elements in a functionally operable manner in the web browser.
The TTI variable is used to differentiate between web pages that are visibly rendered in the browser but have not fully loaded the sub-elements required for usability, such as JavaScript dependencies.
The Time to Interactive (TTI) variable measures the responsiveness of web pages after the First Contentful Paint (FCP). A value of 5 seconds or less is rated as “good” by PSI overall.
Time to First Byte (TTFB)
Time to First Byte (TTFB) measures the total amount of time from the initial request to the return of the first byte of data to the web browser. It is used to measure the combination of domain redirects, DNS server operations, SSL/TLS encryption establishment on connections, and script responsiveness on hardware. “Good” is less than 800 ms, “poor” is greater than 1.8 seconds.
Max Potential First Input Delay
The Max Potential First Input Delay variable measures the worst-case scenarios for a URL with time values for the duration of the longest task after the First Contentful Paint. Lighthouse uses lab data to measure the Max Potential FID for URLs in the generation of the results scores.
The Max Potential First Input Delay value is considered important due to the potential for extra delays in page element downloads not calculated by other metric values. A result of under 130 ms for Max Potential FID is considered “fast,” and any results over 250 ms are rated as “slow.”
Technical analysis by PageSpeed Insights
PageSpeed Insights (PSI) performs an in-depth web page analysis, using lab and field data to identify performance issues and provide actionable insights. It distinguishes between data from controlled lab environments and real user experiences.
Understanding lab data
Lab data is collected in a controlled environment using a set of predefined conditions, allowing for a consistent and reproducible testing scenario.
Google PageSpeed Insights uses the Lighthouse tool for this purpose.
Advantages of lab data:
- Helps debug performance issues before deploying changes.
- Provides a consistent baseline to compare performance changes.
- Includes metrics like First Contentful Paint (FCP), Speed Index, and Time to Interactive (TTI).
Lab data is essential for debugging, though it may not reflect real-world performance due to environmental differences.
How reliable is PageSpeed Insights?
Google does not reveal the exact method by which its search engine algorithms and results page ranking system operate. As a general rule, the lab data provided through PSI is used for reference purposes within the context of platform analytics. The Google search algorithm makes greater use of the exclusive field data generated by Chrome users under a proprietary license.
Insights from field data
Field data from real user experiences offers insights based on actual performance under various network conditions and locations. PSI retrieves this data from the Chrome User Experience Report (CrUX).
Key points include:
- Reflects real-world user experience, accounting for variations in devices and networks.
- Metrics such as First Input Delay (FID) and Largest Contentful Paint (LCP) are critical for gauging user satisfaction.
- Helps identify performance bottlenecks that only appear under specific conditions.
Field data is invaluable for understanding how users perceive the performance of your page in diverse situations.
Interpreting opportunities and diagnostics
PSI reports performance metrics and suggests opportunities and diagnostics to help improve your page’s speed and user experience.
Opportunities:
A Lighthouse audit report generated by PageSpeed Insights has sections for Opportunities, Diagnostics, and Passed Audits. The Opportunities section lists the suggested optimizations that can be implemented to improve the PageSpeed score. The report also shows how much time each solution is expected to return to the page if implemented as recommended.
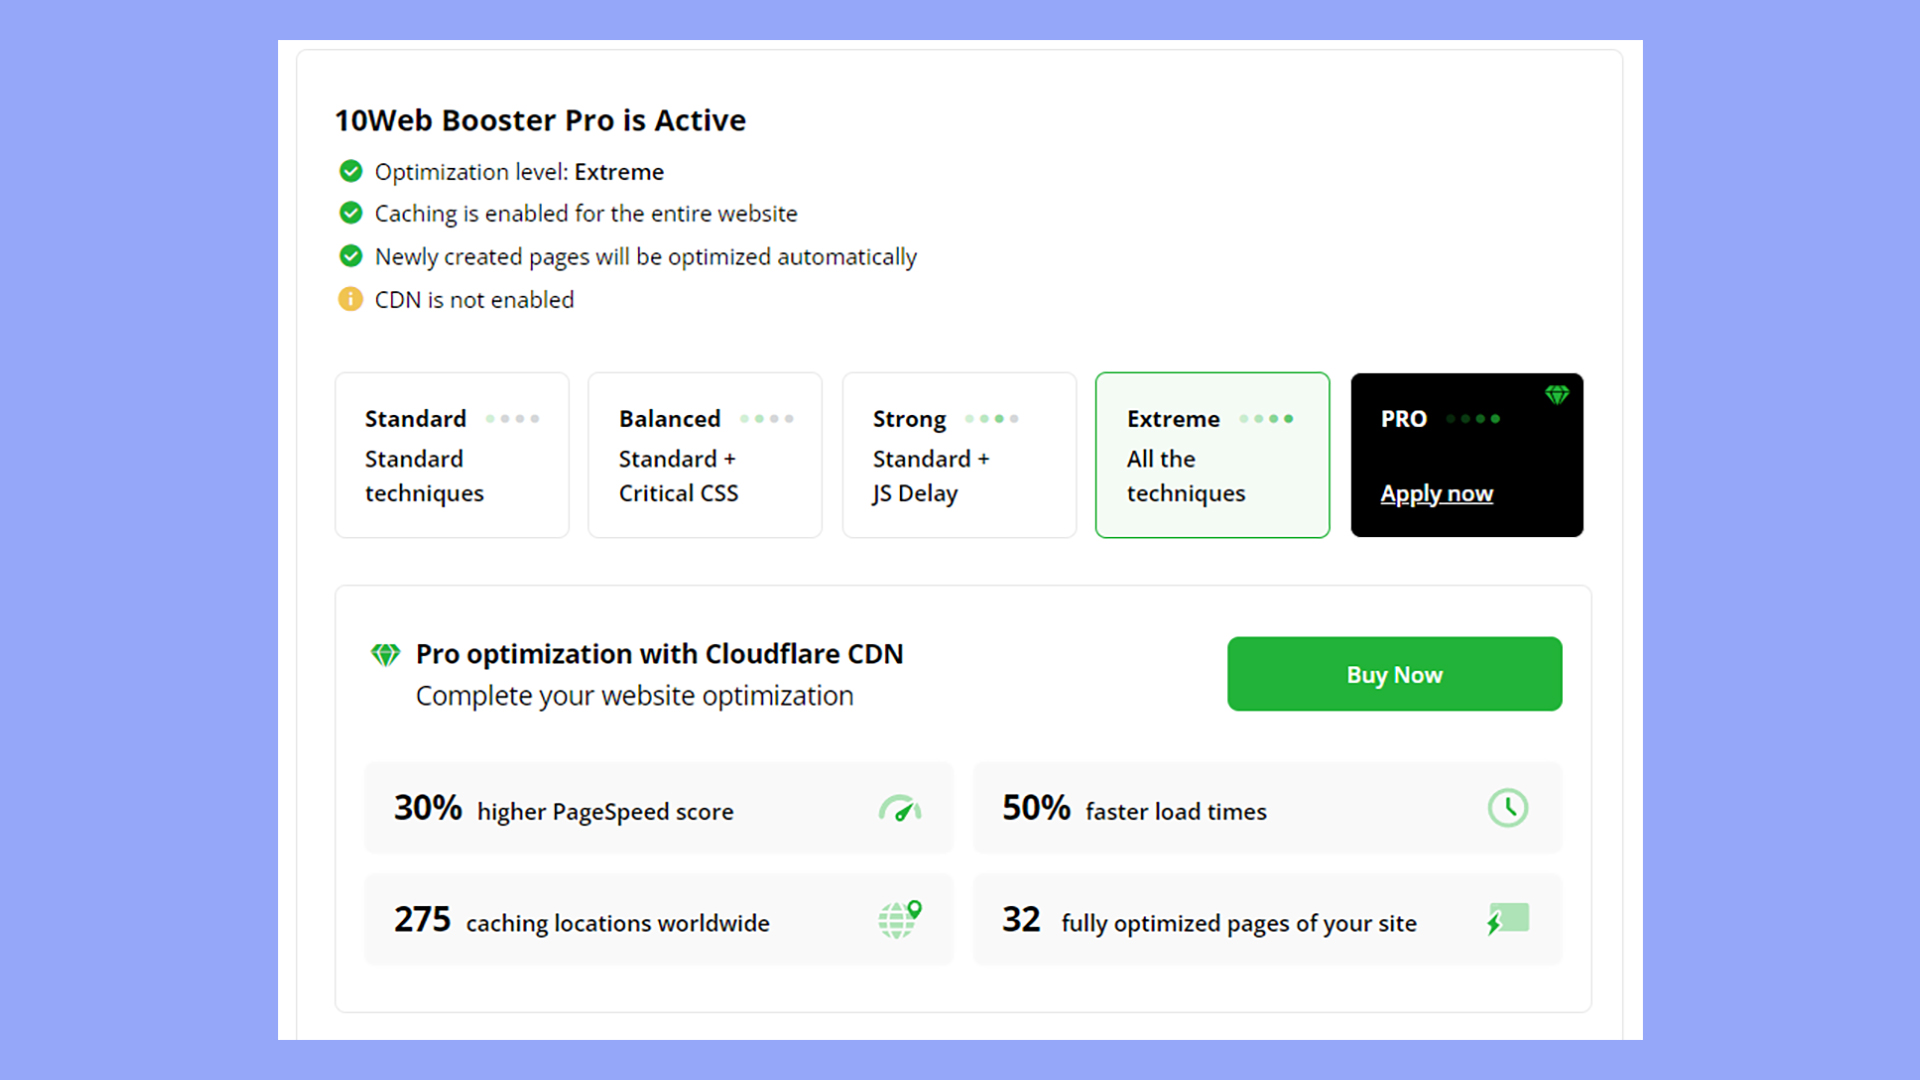
The 10Web Booster automates the implementation of Opportunities based on industry best practices with web scripts and servers. This is the easiest way to attain 90+ PSI scores.
- Include actionable suggestions to improve load times.
- Include items like “Defer offscreen images” or “Eliminate render-blocking resources.”
Diagnostics:
The Diagnostics section of the PageSpeed Insights report adds feedback for webmasters on how a web page adheres to industry standards for internet communications. This section can provide information on code, script, and database performance and their optimization.
- Provide deeper insights into specific issues.
- Include areas such as “Avoid chaining critical requests” or “Ensure text remains visible during webfont load.”
Using these:
- You can prioritize fixes based on the impact on loading times.
- Address the most significant issues first to see noticeable improvements in performance.
Using PageSpeed Insights
PageSpeed Insights (PSI) helps you analyze your website’s performance, offering detailed reports and actionable suggestions for improvement.
The framework does not change or optimize website code. PageSpeed Insights tests web pages by URL for the expected load time on different devices, making the data publicly accessible.
Web publishers can use PageSpeed Insights to test the home page, landing pages, product catalog for ecommerce sites, and content like articles or blogs. After entering the URL address, you will receive a diagnostic report for desktop and mobile device displays. The PageSpeed score ranges from 0 to 100 with a grade report of “good,” “needs improvement,” or “poor.”
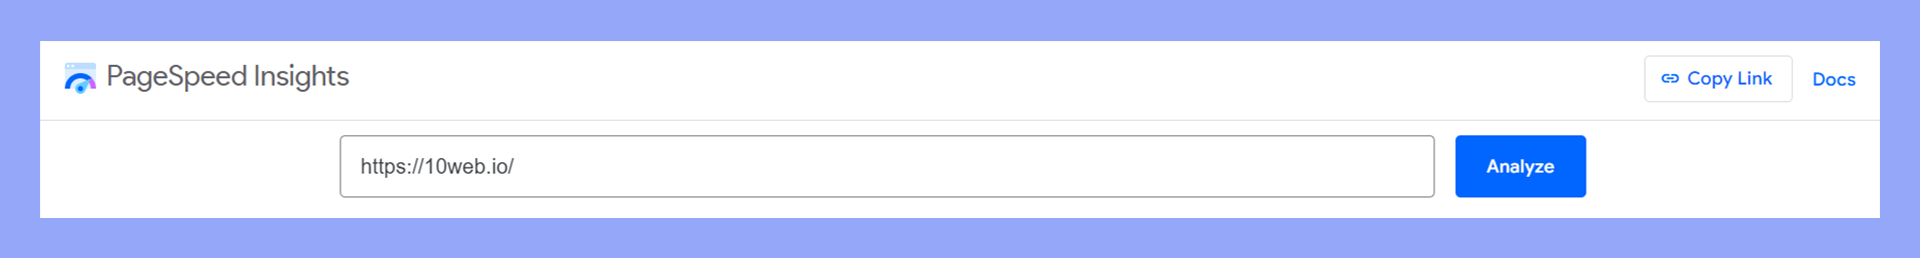
How do I use PageSpeed Insights?
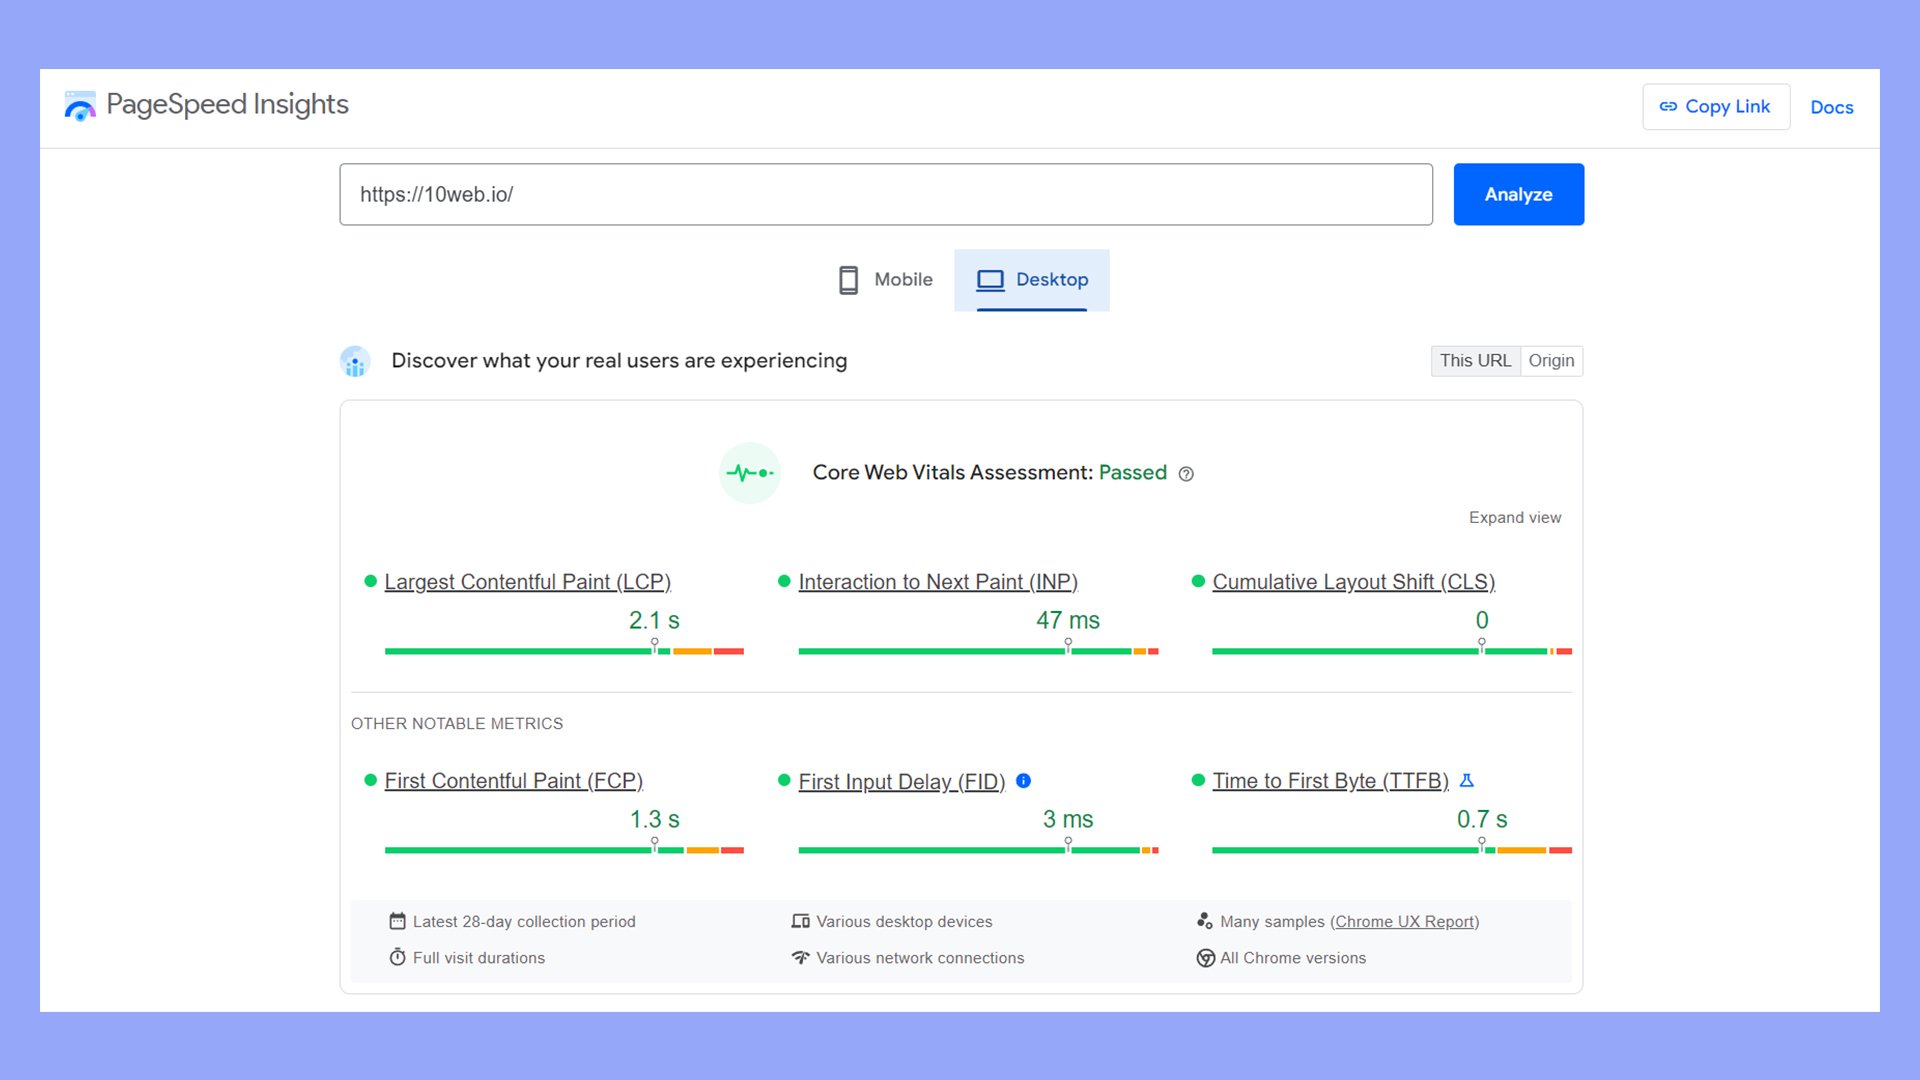
To start, visit PageSpeed Insights. Paste your web page’s URL in the field and click Analyze. PSI will then provide a score out of 100 based on several performance metrics, including loading speed and user experience.
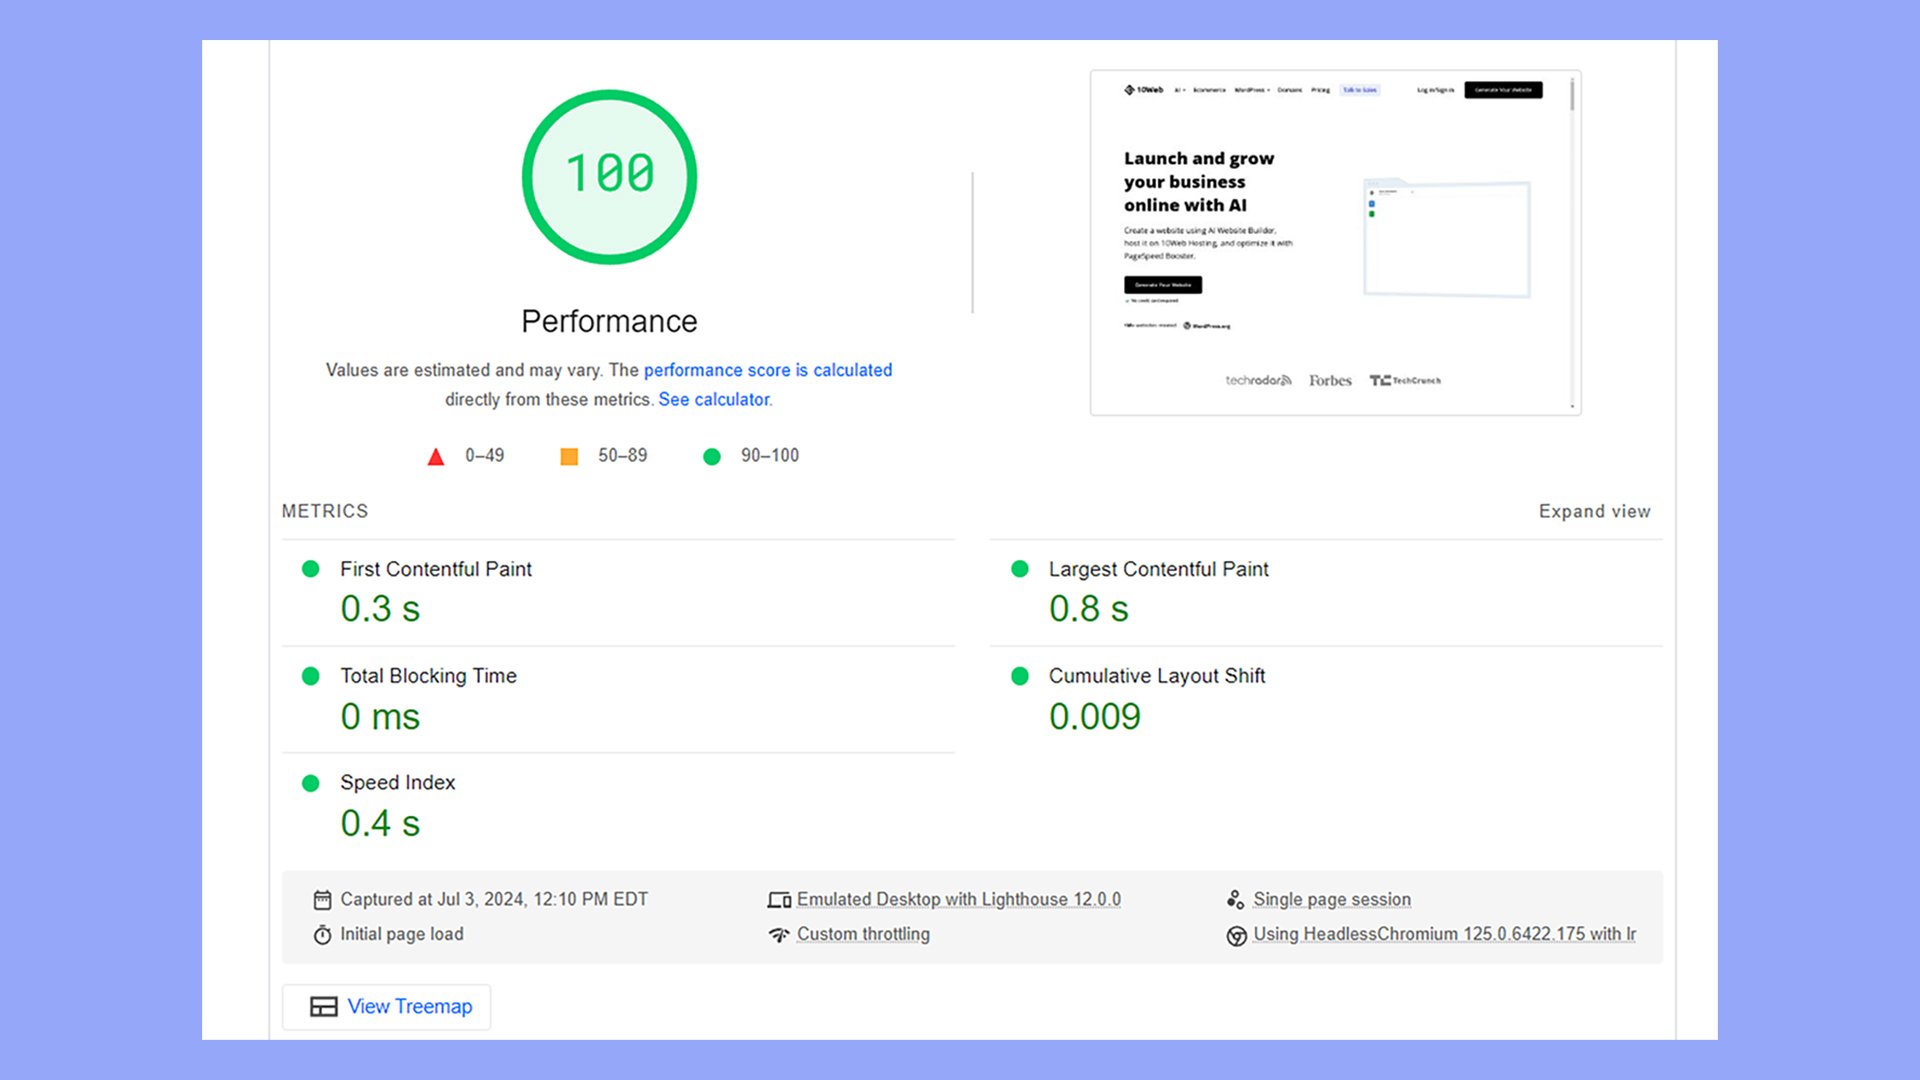
You’ll see both lab data (collected in a controlled environment) and field data (real-world usage data). This helps you understand how your website performs under different conditions.
What is a good PageSpeed score?
According to Google, “A score of 90 or above is considered good. 50 to 90 is a score that needs improvement, and below 50 is considered poor.”
The Lighthouse report generated by PSI is based primarily on lab data and cannot be guaranteed to be replicated across all user devices. For this reason, the use of field data with Core Web Vitals reports can be more valuable for metrics. FID is only measured using real-world data because it depends on user actions.
Lighthouse replicates Core Web Vitals metrics by using Total Blocking Time (TBT) from lab data instead of First Input Delay (FID) from field data. The use of PageSpeed Insights is intended to allow web publishers to view and optimize their PageSpeed scores using open-source tools.
If your pages fail to score 90+ on Google PageSpeed tests, consider an option like 10Web Booster. The ability to fully automate web server and script optimization leads to faster TTFB.
How to improve your PageSpeed score
In order to improve your Google PageSpeed Insights score, first implement the recommendations from the Opportunities and Diagnostics pages in the report screen.
Common recommendations listed under Opportunities are to defer offscreen images, eliminate render-blocking resources, and remove unused CSS. Diagnostics reports suggest reducing the impact of third-party code, minimizing threads, avoiding excessive DOM size, implementing caching, and eliminating long JavaScript execution times. Add plugins to CMS sites for this.
By automating these tasks consistently across all website pages using a PageSpeed utility like 10Web Booster, you can more easily improve Google PageSpeed scores.
10Web Booster will optimize WordPress CMS script functionality (including WooCommerce and other ecommerce store solutions) without the need to install any modules or plugins to your site for it to work.
Below are some of the main techniques implemented by 10Web Booster to improve PageSpeed Insights scores. These techniques are also recommended for improving Core Web Vitals ratings. All of the options are derived from the PageSpeed Insights audit reports.
Optimizing content efficiency
Optimizing images through file size compression and format conversion is one of the best ways to reduce the total size of downloads required on web pages.
- Compress images and convert them to modern formats like WebP.
- Implement lazy loading to defer offscreen images, ensuring they load only when needed.
- Serve static assets efficiently by enabling browser caching for repeat visits.
- Inline critical CSS to minimize render-blocking resources.
- Reduce excessive DOM size and eliminate unnecessary elements to keep the page lightweight and fast.
In addition, responsive images with the srcset attribute can be used to serve different images based on the user’s device. This not only saves bandwidth but also improves loading times on mobile devices.
Leveraging modern web technologies
Using modern web technologies can enhance site performance.
- Implement HTTP/2 to allow multiple resource requests over a single connection.
- Use service workers for effective caching and offline capabilities.
- Consider Progressive Web Apps (PWAs) to provide a native app-like experience.
- Implement code splitting to load only necessary JavaScript, improving initial load times.
- Adopt AMP (Accelerated Mobile Pages) for faster mobile performance.
Improving server response times
Server response time affects how quickly your site starts loading. Monitor and reduce the Time to First Byte (TTFB) to ensure fast initial server responses. Google requires a server response time of less than 200 ms to pass the PageSpeed Insights test with a “good” rating. The fastest sites set a target of less than 100 ms for server response.
The server response time depends on DNS routing, domain redirects, and the scripts running on the hardware in a data center. A multi-layered, automated solution like 10Web Booster includes both front-end and back-end optimization for a website. CDN caching will also improve web server response times by distributing content geographically, reducing latency.
Minimizing and compressing resources
Reducing the size of your CSS and JavaScript files can lead to faster load times. Minification removes unrequired code elements from HTML, CSS, and JavaScript files, making the package even smaller when compressed. The 10Web Booster platform enables automatic compression and minification of HTML, CSS, and image files so they load faster in the browser.
- Minify CSS and JavaScript by removing unnecessary characters like spaces and comments.
- Tools like UglifyJS for JavaScript and CSSNano for CSS can automate this process.
- Combining multiple files into a single file reduces the number of HTTP requests, speeding up load times.
Additionally, make sure only to load the necessary CSS and JavaScript for each page. Tools like UnCSS and PurifyCSS can identify unused CSS and JavaScript.
Eliminate render-blocking JavaScript
JavaScript loads first in a web browser, which can cause delays if a website includes a large number of JavaScript files used for rendering the interface and content displays.
One way to improve this is to delay the call for JavaScript files until after loading the primary page elements. Asynchronous loading of JavaScript ensures that scripts that are not crucial to the first paint are loaded later, preventing delays in rendering the page content.
This allows publishers to prioritize above-the-fold content and attain faster PageSpeed scores. Combining the required files for each page load before they are minified and compressed is another popular method to eliminate render-blocking JavaScript.
Prioritize above-the-fold content
Compression and minification of HTML, CSS, and JavaScript files are used to prioritize above-the-fold content on web pages so that a small initial target file size can be attained.
Web pages that require excessive data to load the above-the-fold content for the user will need to make repeated browser calls from the server, increasing the total response time and decreasing PageSpeed Insight scores. For better results with Google PageSpeed optimization, limiting the use of images and third-party widgets in this section is recommended.
Structure HTML to load visible content elements first to pass the Google PageSpeed testing requirements across all variables and metrics. The compression and minification of required script files is a core feature that is automated with the 10Web Booster platform functionality.
Critical CSS
Another PageSpeed Insights optimization used to improve page load times is prioritizing critical CSS files by injecting them into HTML pages as inline scripts. This avoids the need to load CSS as a separate file and permits a lower overall total file size for faster browsing speeds.
Instead of loading a stylesheet with the code for the entire website, it is recommended only to load the CSS that is actually used by the given page. Avoid excessive CSS file size for better website performance. 10Web Booster optimization implements these features automatically across websites by configuring the webserver to implement best practices for PSI in production.
Utilizing browser caching
Browser caching locally saves static resources like images, CSS, and JavaScript files on the user’s device. This allows web pages to load faster by leveraging the browser cache to store GUI elements like scripts and images that are repeatedly used across the domain.
You can set cache-control headers to define how long browsers should store these resources.
For example, Cache-Control: max-age=31536000 tells the browser to keep the resource for one year.
Another critical aspect is setting appropriate versioning for your files.
When you update a resource, altering its URL by appending a version query string (e.g., style.css?v=2) ensures that browsers fetch the latest version instead of the cached one.
This combination of static resource caching and proper versioning results in a fast and responsive website.
These techniques help optimize the PageSpeed Score for mobile and desktop. However, you can use some device-specific best practices to ensure your pages score well on any size screen.
Mobile optimization
Optimizing your site for mobile is crucial as many users browse on smartphones or tablets.
PSI offers insights into mobile performance, such as avoiding large layout shifts and minimizing input delay.
Ensure your site uses a responsive design to adapt to various screen sizes.
Focus on reducing the Largest Contentful Paint (LCP) time, which measures how quickly the main content loads.
Defer or inline JavaScript and CSS to avoid render-blocking resources that slow down mobile page loads.
Desktop optimization
Desktop users expect quick load times and seamless interactions.
PSI evaluates your site’s desktop performance, highlighting areas like First Contentful Paint (FCP) and Cumulative Layout Shift (CLS).
Optimize images and other assets using efficient formats. Implement compression techniques like Gzip to reduce file sizes.
Eliminate unused CSS and JavaScript to streamline resource loading.
Defer non-critical JavaScript to speed up initial rendering.
Building for accessibility and traffic growth
Improving both accessibility and traffic is crucial for expanding your website’s reach. By making your site accessible and preparing it for high traffic, you help ensure better performance and user satisfaction.
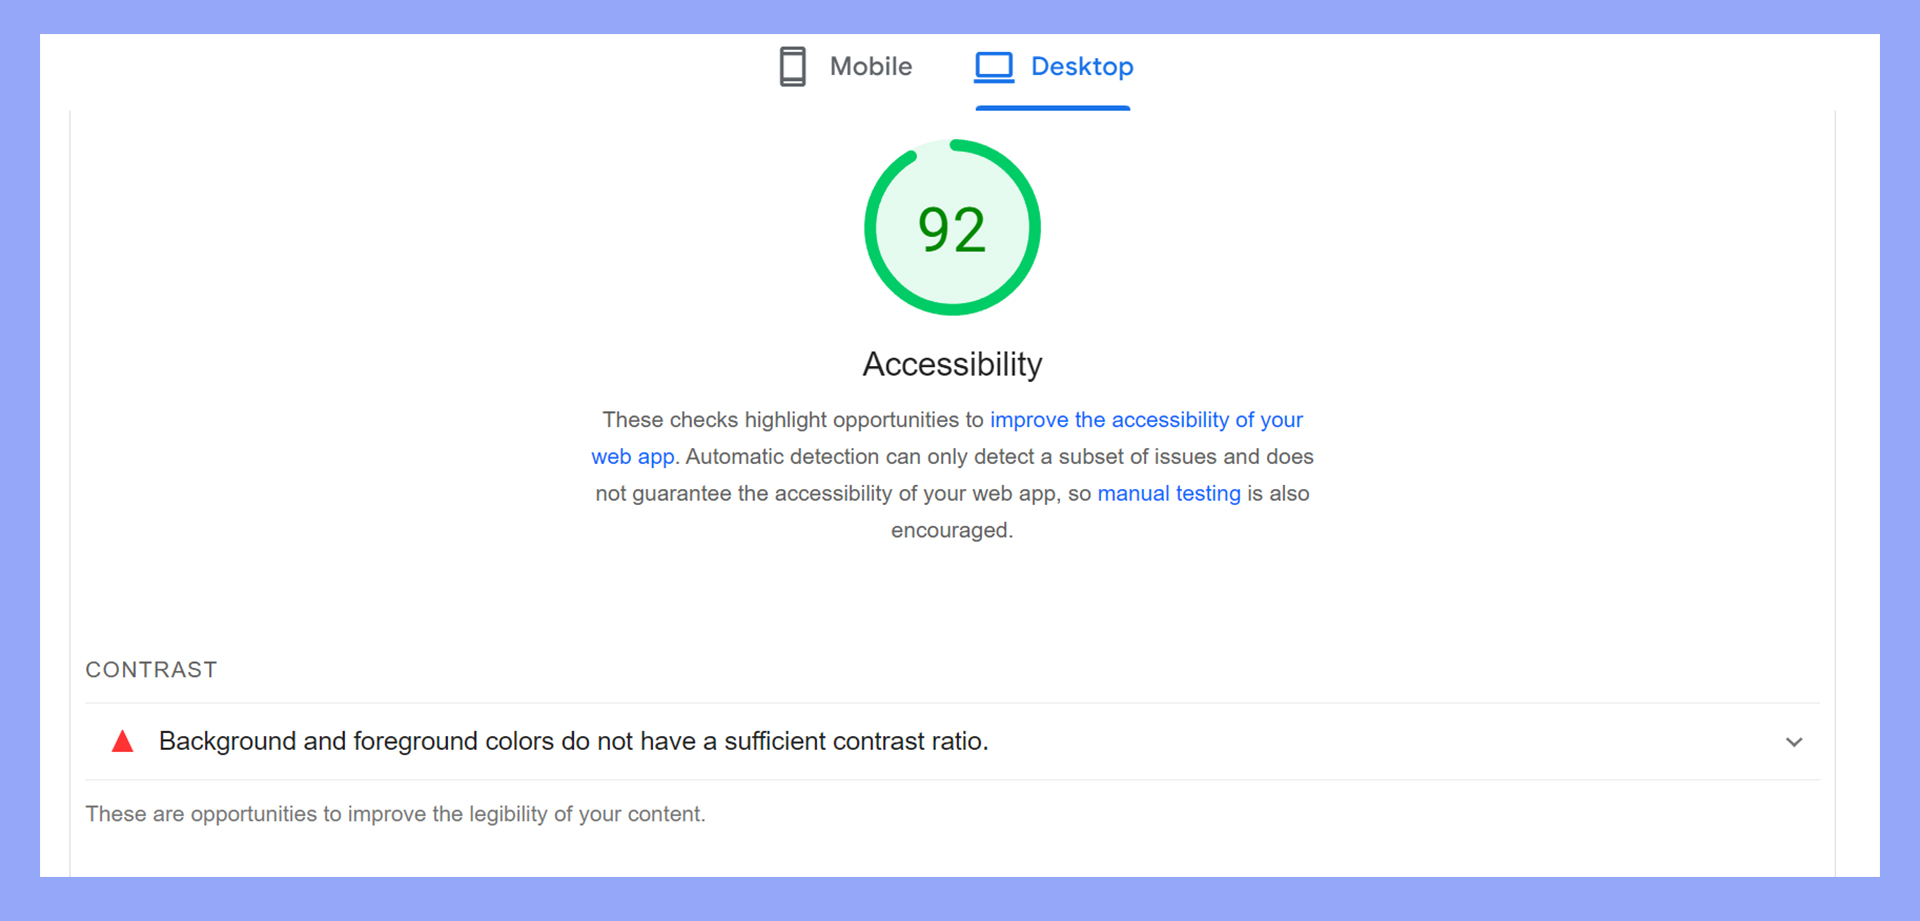
Accessibility considerations
Ensuring your website meets accessibility standards allows people with disabilities to use your site effectively.
It’s important to follow guidelines like the Web Content Accessibility Guidelines (WCAG).
This includes providing alternative text for images, keyboard navigability, and clear headings and labels.
Keeping your site inclusive not only helps users with disabilities but can positively impact your PageSpeed Insights score.
Moreover, accessibility features can improve SEO since search engines recognize and reward well-structured, accessible content.
Preparing for increased traffic
Preparing your site for increased traffic involves several technical steps.
Start by using a Content Delivery Network (CDN) to distribute your content globally, which helps reduce load times.
Optimizing your server and database performance is also vital. Use caching strategies, minimize HTTP requests, and compress large files.
Ensure your website’s backend is robust enough to handle traffic spikes.
Regularly test your site under different load conditions. Crawling tools and audits can help you identify bottlenecks.
This way, your site remains functional and swift even during high-traffic periods, maintaining user satisfaction and performance.
Tools and services for performance insights
Understanding and improving your website’s performance is crucial. These tools and services can help you gauge your site’s speed and usability while providing actionable insights.
Google’s Lighthouse integration
Google’s Lighthouse is an open-source tool that you can use to audit the health of any webpage.
Lighthouse is integrated into Chrome DevTools and offers detailed reports on various performance metrics.
You can access Lighthouse by opening Chrome DevTools, navigating to the “Lighthouse” tab, and running an audit.
It breaks down results into performance, accessibility, best practices, SEO, and Progressive Web App (PWA) categories.
Lighthouse provides specific suggestions to improve your site, like compressing images or reducing JavaScript execution time.
The tool’s seamless integration with Chrome makes it accessible and useful for both beginners and experienced developers.
Third-party analysis tools
Several third-party tools complement Google’s offerings by providing additional insights and features.
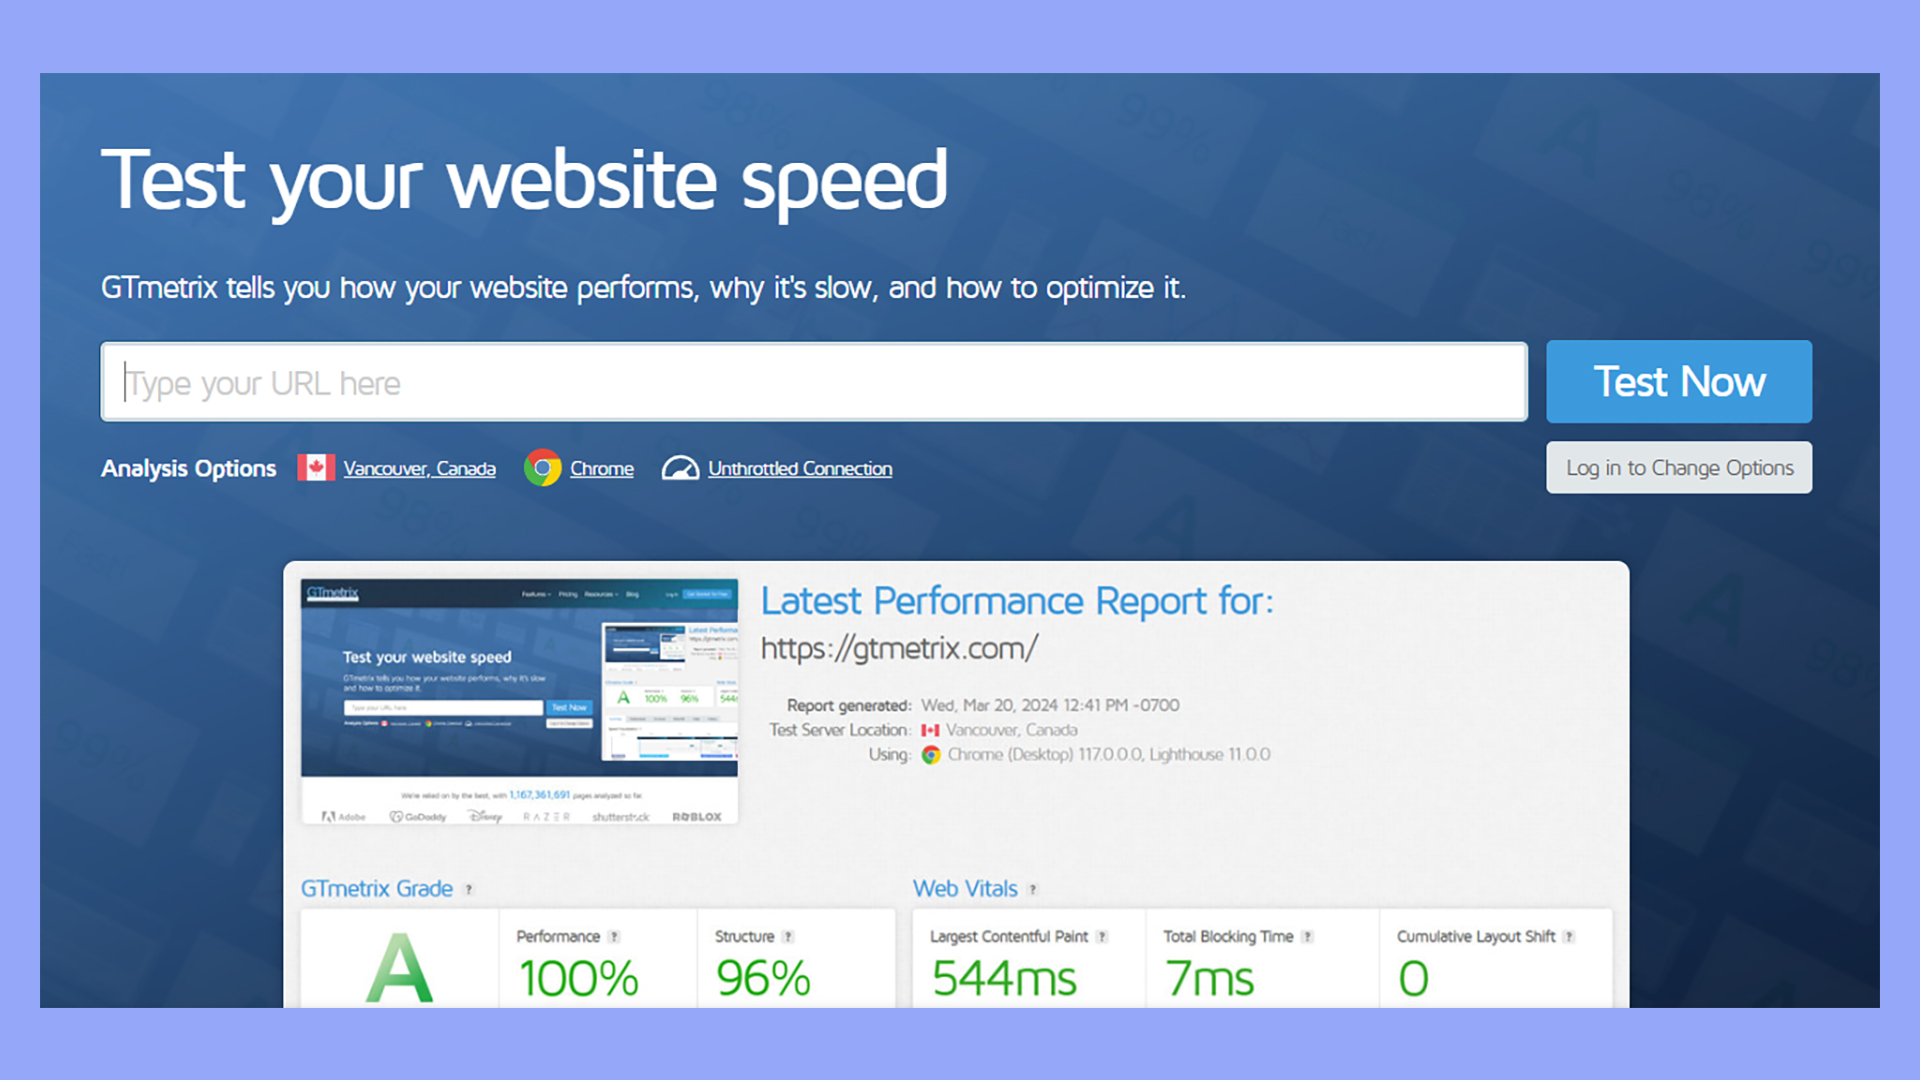
Tools like GTmetrix and Pingdom allow you to test your site’s speed from various global locations, compare it with competitors, and track performance over time.
WebPageTest offers a detailed breakdown of loading processes, including first-byte time, start render time, and fully loaded time.
This can help you pinpoint precise areas needing improvement.
Using a mix of these tools lets you cross-verify results and ensures you’re covering all bases.
They often provide visual tools, like waterfall charts, making it easier to understand complex performance issues.
Understanding passed audits
The Passed Audits section of the PageSpeed Insights report for a URL simply shows which tests the page has passed when Lighthouse runs the benchmark comparisons from lab data. If the page fails an audit, the reasons will be displayed, along with suggestions for repair.
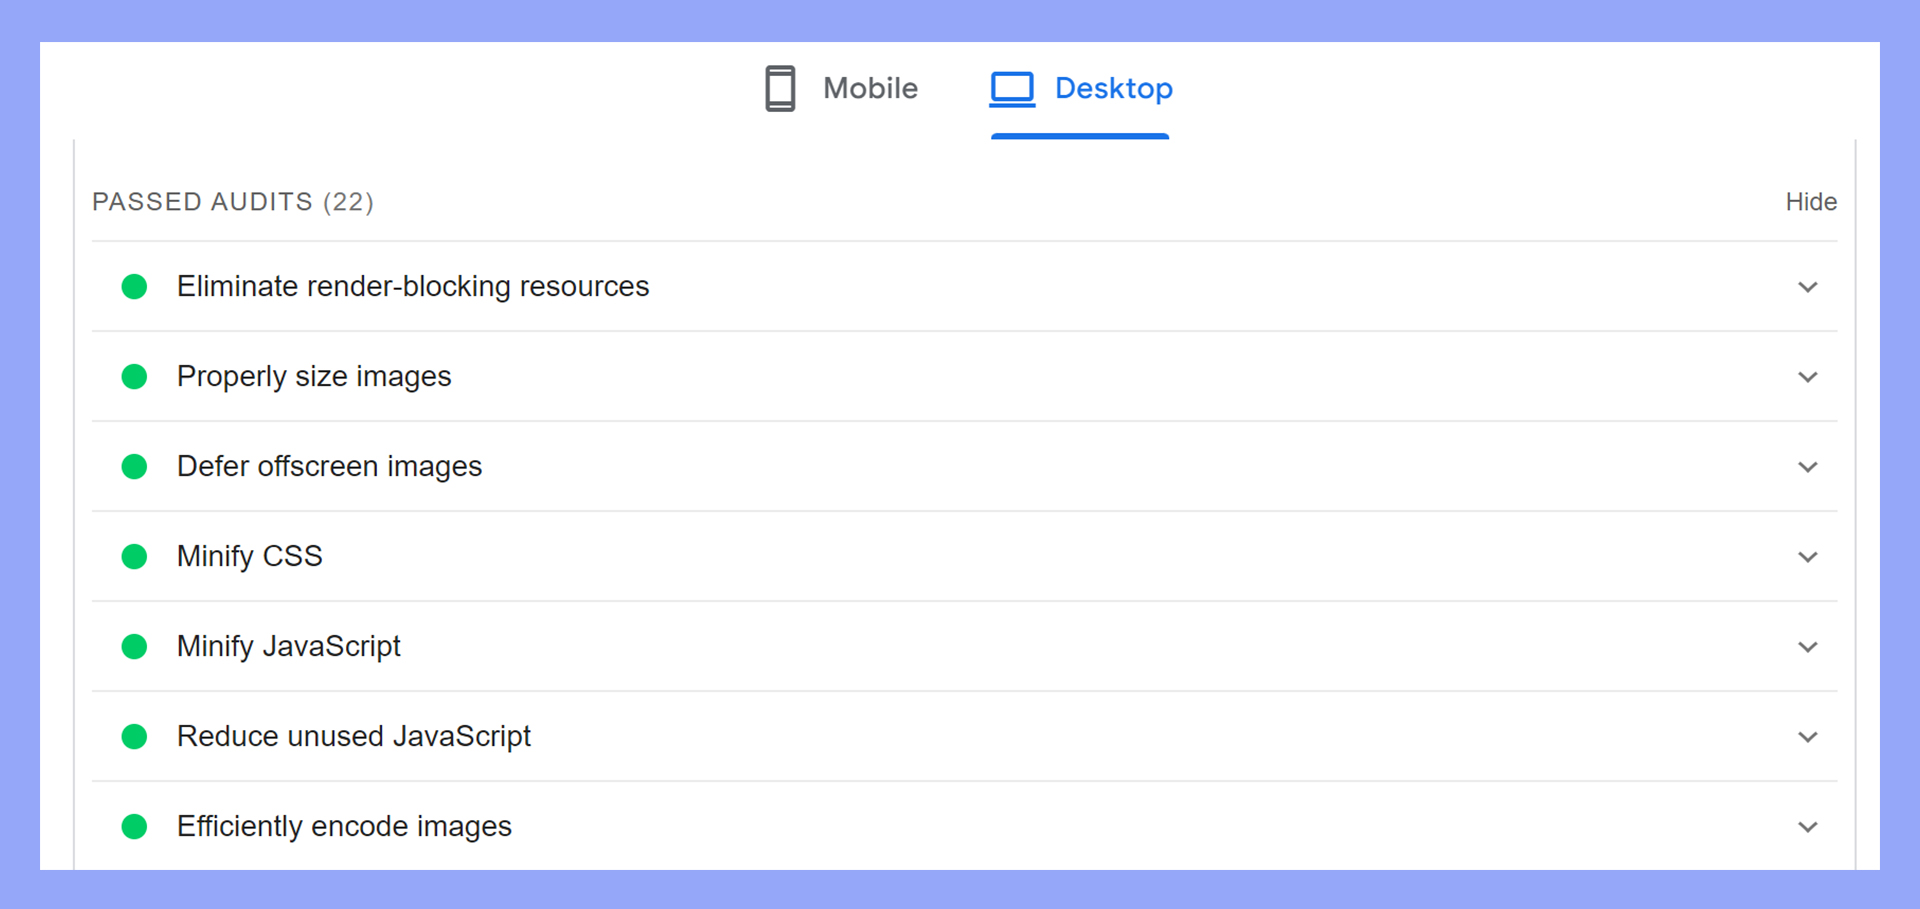
These tests check various performance aspects, like efficient image formats and leveraging browser caching.
Seeing what your website does right gives you confidence and benchmarks.
Keep an eye on audits related to HTML, CSS, and JavaScript, as they tell you a lot about the backend performance.
Understanding these can help you avoid over-optimization efforts, freeing you up to focus on critical parts that need work.
Prioritizing recommendations
Recommendations indicate areas needing improvement.
They can include optimizing images, reducing server response time, and eliminating render-blocking resources.
These hints are prioritized by their impact on performance. Look for recommendations with high impact first.
Fixing these will likely yield the most noticeable improvements in speed. Use the Performance Score, ranging from 0 to 100, to gauge urgency.
Identifying quick wins for speed optimization
Quick wins are changes that require little effort but bring significant improvements.
Common quick wins include minifying CSS, JavaScript, and HTML and enabling compression.
Another quick win might be using a content delivery network (CDN) to distribute your content geographically, ensuring faster load times.
These simple steps can make a big difference in performance and overall user satisfaction.
In conclusion, PageSpeed Insights is an invaluable tool for web publishers aiming to optimize their website performance and improve user experience. By focusing on key metrics like LCP, FID, and CLS and implementing PSI’s recommendations, publishers can enhance page load speeds, boost SEO rankings, and ultimately provide a better browsing experience.
Utilizing tools like 10Web Booster for automation and adopting best practices for content efficiency and server optimization are crucial steps in maintaining high PageSpeed scores. Consistently monitoring and optimizing with PSI ensures websites remain fast, responsive, and competitive in search engine rankings.
Subscribe to AI insights
- The latest trending AI news
- How AI boosts efficiency at 10Web
- In-depth reviews of AI tools
- Entrepreneurial wisdom and insights
- Valuable business growth tips
Share article
-
 Copy
Copy
-
-
-