
Running a website is much like having a house. It is very important that you stay on top of everything that goes on in it. Such as, who goes in and out of your website, how long they stay, where they come from, and where they go out from or what they do once they’re in.
There’s a certain point in any online platform’s growth, where you need to stop planning based on guesswork and start growing based on factual data and statistics.
Identifying the patterns in these statistics and data is what defines analytics.
When it comes to the marketing aspect of your site, the most important part of your statistical feedback is website traffic analytics.
There are many website traffic metrics to track. The specific examples that I’m about to mention are all found in Google Analytics. Let’s discuss them in more detail.
- What’s a website traffic metric?
- Website Traffic
- Conversion Rate
- Demographics & Traffic Source
- New Users vs Returning Users
- Bounce Rate
- Lead Generation Costs
- Exit Pages
- Top Visited Pages
- Average Time on Site
- Speed
But first, let’s answer the most urgent question:
What’s a website traffic metric?
Website traffic, that is the number of visitors your site gets in a set timeframe, is actually more complex than it seems, and you can interpret it in many ways. A website traffic metric is a quantifiable indicator of an aspect of your website’s popularity. Different metrics answer different questions you may have about your site: What’s the most popular page? How long do my visitors usually stay? What causes them to leave? What percent of visitors then becomes a customer? What does gaining a client cost me on average?
All these questions largely pertain to the big questions: You place ads and use other techniques to get website visitors. They enter your site at point A and, ideally, they’d exit it as clients (readers, registered users, buyers, etc.). And yet, they often wiggle out of some point B. The question is, what happens? Why do conversions fail and how do they succeed?
As we mentioned earlier, the metric examples in this article can be found on Google Analytics, the most popular website analysis tool. If you have a WordPress website then a very convenient way of getting all your Google Analytics results straight on your WordPress sidebar is by installing the WD Google Analytics plugin. It also conveniently adds an easy-to-read analytics dashboard straight to your WordPress dashboard panel.
In the list, you’ll see a lot of metrics that are meant to track your conversions from various sources.
To use these metrics you need to start tracking your conversions separately, so you can use them in various segments later. Follow this tutorial and set up goals to start tracking your conversions.
Now onto some of the most important metrics that you need to pay attention to:
1. Website Traffic
Let’s start off with the single metric that enables and gives significance to every other metric.
Traffic, or session as it’s listed in Google Analytics, does not signify success by its own, since different companies have different objectives and manage traffic in different ways.
On the other hand, patterns in traffic data can reveal a lot about your website’s overall direction. Increases or decreases in traffic are huge identifiers in the overall correct implementation and execution of your marketing strategies.
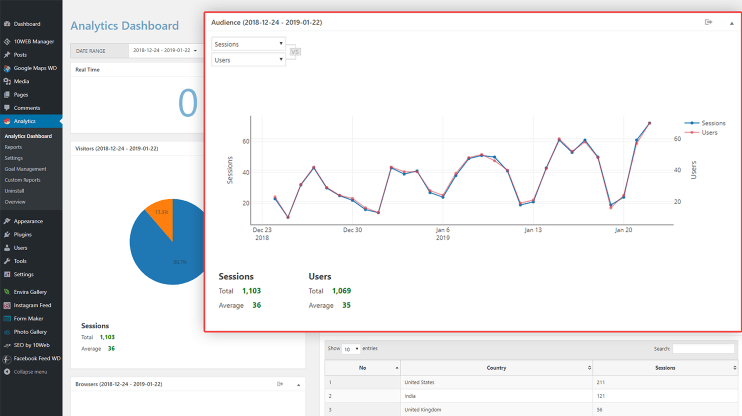
So, how to track website traffic? The easiest and most popular way is to use Google Analytics. The great thing about it is that you’ll also get all other relevant stats and can start analyzing comprehensive data related to your site.
2. Conversion Rate
Conversion rate defines the number of users that convert from “passive visitors” — who read through your content and leave, to “active visitors” who eventually buy your product, sign-up to your website, or click on requested links.
Converted active visitors are the necessary factor in achieving the marketing goals you’ve set up (conversions).
To track your site’s conversion rate, you need to isolate conversions from returning visitors, then compare the patterns.
If your new visitors’ conversion rate is on the decline, then you need to take a look at what new users lay their eyes on when they first visit your site and work on optimizing and improving that experience for them.
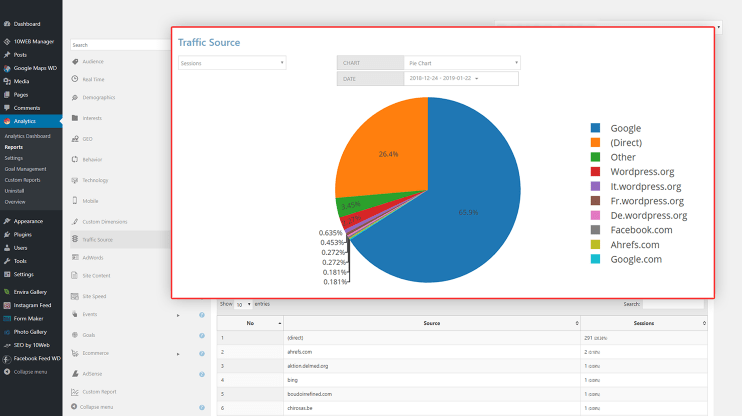
3. Demographics & Traffic Source
Through the demographics section of your Google Analytics, you can look at how your users are segmented based on their age, gender, geolocation, etc.
Using this information you can draw a more accurate representation of your user base, to enhance your marketing strategy.
Traffic source, on the other hand, is split into 3 main sections — direct visitors, search visitors, referral visitors — each source is important in its own way, so having an overview on where your users are coming from can provide a lot of valuable information so you can plan your content strategy accordingly.
- Search visitors — users who have found your website through online search engines, such as, Google and Bing.
- Direct visitors — users who visit your website directly by typing the URL in the address bar of their browser.
- Referral visitors — users who find your website by following a link from another website that redirects them to yours. This source is extremely important if you use referral marketing as your main traffic source.
Note that recently a lot of traffic comes from social media websites: people often follow the links their friends share rather than go browsing the web on their own. To increase visitors arriving through social media sites, make sure to have social sharing buttons on your shareable content or even directly encourage social sharing.
4. New Users vs Returning Users
You can check the percentage of your returning users to new users in the “Behavior” section of your Google Analytics then clicking on “New vs Returning” and then by comparing the data, you can check how many of your users are returning visitors.
This way you’ll figure out if your current content, landing pages, and user experience are working as intended in retaining your users to revisit your site.
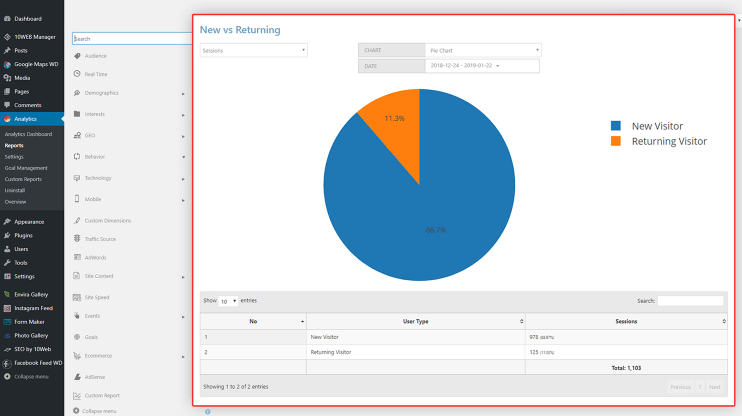
High returning visitor percentage is a good indication that your website offers valuable information and content that incentivizes users to return.
5. Bounce Rate
This metric shows how many of your visitors have left the website right after their arrival, aka single-page sessions. If the percentage of this metric is too high, that means your users aren’t sticking around browsing the content of your site.
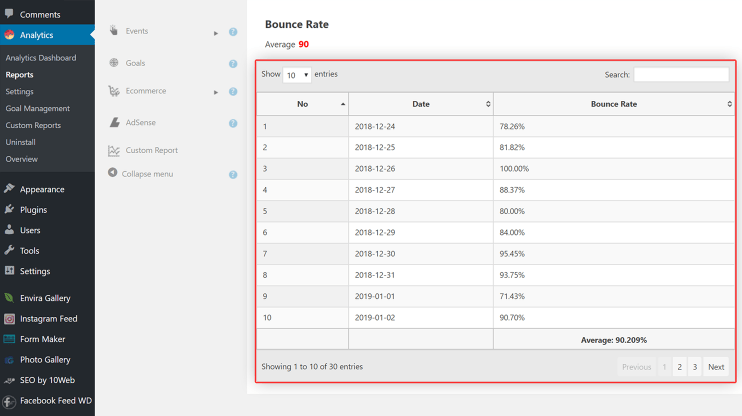
Bounce rates carry more importance with some websites than others, it all depends on the type of your website. So a high percentage isn’t necessarily a bad thing, but that’s up to you and your site’s objectives.
Bounce rate also doesn’t tell you the reason why people might be leaving after a single page.
You might want to check on the first impression your landing pages are giving and increase the quality of your content so that your users are incentivized to browse more.
When it comes to landing pages, the rule of thumb is to simplify it as much as possible so the visitor immediately understands what your website’s main promise is and how you’re going to deliver on it. Minimum text, clear messaging, sleek design, a couple of reviews and a short description of the company or the person the site is dedicated to. That’s all you need for a good first impression.
Another tip is to consider all the possible reasons why people bounce the page and A/B test them all to find out which of the suspects is to blame.
6. Lead Generation Costs
Sometimes referred to as “cost per conversion”, this website traffic metric that you’ll find in the “E-commerce” section of your analytics tracks just how much you’re paying for lead generation. At some point, even if your advertisements or paid referrals are bringing in a lot of conversions, but your net income is below 0 from your lead generated sources, then perhaps it’s time to revise your referral and ad campaigns.
7. Exit Pages
In some cases, you’ll notice that despite your low bounce rates in relation your conversion rating isn’t increasing. The exit pages metric will show you the pages that have the highest amount of visitors leaving your site from them.
Generally, you’d want your exit pages to be along the lines of either your subscription confirmation pages or your checkout pages if you’re running an online marketplace.
If you have low bounce rates and your visitors aren’t leaving after a single page, you need to identify those exit pages and fixing the underlying issues will work wonders in increasing the conversion rating of your site.
8. Top Visited Pages
Besides keeping tabs on where your visitors come from and where they leave your site from, you need to keep track of the specific pages that your visitors are most attracted to.
This website traffic metric is the best indication of what’s most appealing to your users. If you’ve had different sorts of content on your site, by tracking this metric you can identify the most successful types of content on your site and shift your content production in that direction.
Sometimes your top pages might be a result of referral visitors, analyzing and comparing your traffic sources with your top pages should give you the information you need on which pages are organically attracting visitors and which are due to referral visitors.
Automated PageSpeed Boost With #1 WP Hosting
Get 90+ PageSpeed Score and boost Core Web Vitals by migrating your client websites to 10Web – all within minutes, all automatically.
Automated PageSpeed Boost With #1 WP Hosting
Get 90+ PageSpeed Score and boost Core Web Vitals by migrating your client websites to 10Web – all within minutes, all automatically.

9. Average Time on Site
The “average time on site” metric calculates how long your users are spending on your site per each session. Analyzing this data should provide a good indication of how engaging your site is to your users.
You just have to monitor closely to make sure that your users’ session duration on each page corresponds correctly with the content and/or function that those pages represent.
10. Conversion by Traffic Source
Earlier in the article, we looked at the three categories of traffic source and how to track them.
To track your conversions based on where your users have reached your website from you need to go to custom reports, select your conversions tracker from the “Metric” tab and add your desired traffic source from the “Dimension” tab and give your custom report a name.
This way you can track your conversion rate per traffic source to see their actual effectiveness besides the amount of traffic they bring to your site.
11. Speed
Sure, we had promised you just 10 website traffic metrics it’s important to keep track of but no web traffic metric listicle can be complete without a mention of the significance of speed. With the constant betterment of technology, the average is growing less and less patient. Nowadays, your page needs to load in just 2 seconds to be able to retain its visitors and leave them satisfied.
Google’s algorithm definitely also favors faster websites, so reducing your load time as much as possible will also lead to higher search engine rankings and a surge in organic traffic.
Now, how does Google Analytics go about accounting for website speed? You can view a report of all your webpages in the “Page Timings” report, as well as take a look at the “Speed suggestions” report to find out where exactly you went wrong.
Besides the “Reports” section in Google Analytics, Google has also devised a way for you to grade your site’s performance online. Here you can write in your URL and find out your website’s PageSpeed score. Typically, what you should be aiming for is a score of 90+.
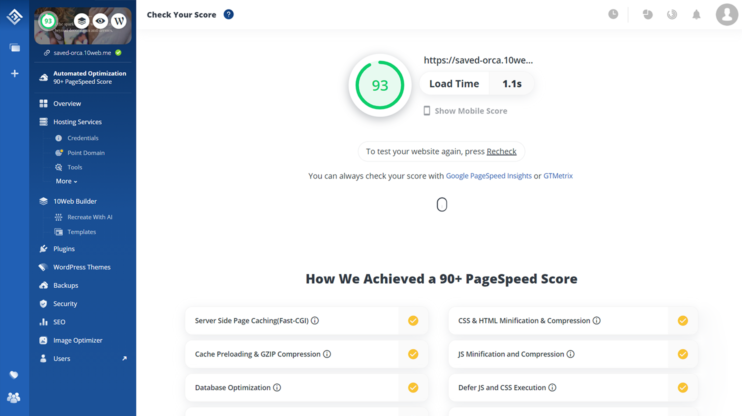
What can you do if your site’s PageSpeed score is too low? The big contributing factor is hosting. By switching to 10Web’s automated hosting that costs just 10 dollars a month in a click, you can instantly get a score of 90+ and stop worrying about hosting slowing down your site.
As mentioned earlier, we got all these web traffic metrics by using the Google Analytics WD plugin, which you can read some more about it in this WP Buffs article.
As a final reminder, while all of these website traffic metrics are important, it is up to you to figure out which ones suit best for your site and objectives. Then identify and optimize them to maximize the efficiency of your website’s analytics. Do you keep track of these metrics on your website? What sort of changes have you made as a result of traffic analysis? Let us know in the comments below!
Build a website with AI in one minute
Generate your website now for Free
Create your dream website with 10Web AI Website Builder and take your business online!

Wait!
Your online store
is a click away
Your online store is a click away
-
 Create an ecommerce website in 1 minute with AI
 -
Set up and manage payments, products & more
-
Grow your business with all in one platform
 Create an ecommerce website in 1 minute with AI