At this point, you’ve most likely heard about Core Web Vitals, Google’s new page experience measuring tools. Announced in May 2020 and incorporated into the ranking algorithms just last month, Core Web Vitals are another key way for Google to approximate the quality of user experience that a website offers. As the focus of Core Web Vitals is on an overall pleasant user experience, even if your website currently ranks at #1, this article will still be useful in terms of improving conversion rates of your website and decreasing the bounce rate.
Whether you’re a developer immersed in code, an agency looking to set yourself apart from competition, or a small business owner just trying to run your website, it is important to be mindful of these new updates as they are Google’s way of fine tuning its ranking process. We know the importance SEO (Search Engine Optimization) has on ranking and conversion rates, and understanding Google’s evolving algorithm criteria is crucial, no matter what your background or goals. In this article, we will break down everything there is to know about Core Web Vitals so you can take the necessary steps to ensure your website remains in Google’s good graces.
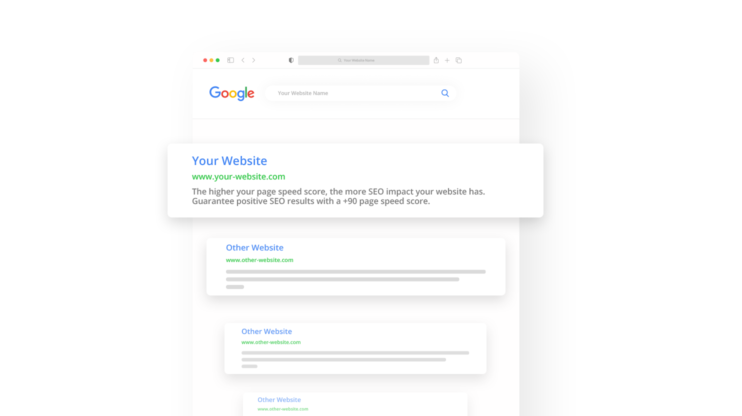
Need a 90+ PageSpeed score?
With 10Web, you can get it automatically!
Need a 90+ PageSpeed score?
With 10Web, you can get it automatically!

What are Core Web Vitals?
Core Web Vitals are a subset of three factors that Google will be using as part of its page experience score. Expected to finish rolling out to all global users by August of this year, Core Web Vitals join Google’s existing search signals, such as mobile-friendliness, safe-browsing, HTTPS-security, and intrusive interstitial guidelines. The short and sweet definitions are as follows, but don’t worry—we will go into more detail later:
- Largest Contentful Paint (LCP): Largest Contentful Paint focuses on loading time, specifically in regards to the largest element found on the screen.
- First Input Delay (FID): First Input Delay focuses on interactiveness, specifically in terms of a website’s response rate.
- Cumulative Layout Shift (CLS): Cumulative Layout Shift, the final metric, takes into account the visual stability of a website, specifically in terms of layout shifts.
The reasoning behind the introduction of Core Web Vitals isn’t exactly new; instead, it’s an extension of what Google has been implementing since 2010. Site performance—specifically page speed score, was announced as a ranking signal in desktop searches over a decade ago.
The reasoning according to Google? Simple:
“Users want to find answers to their questions quickly and data shows that people really care about how quickly their pages load.”
And Google didn’t stop there. After realizing that “more than half of visits are abandoned if a mobile page takes over 3 seconds to load”, Google applied page speed as a ranking factor in mobile searches in July 2018. Page speed has become an absolute priority in Google’s algorithm, and your website’s optimization speed (per PageSpeed Insights results) is how Google calculates page rank for SEO. Even ads strategically placed on a landing page become ineffective when your site’s bounce rate is high due to a low page load speed. As Google notes:
“Advertising and speed go hand in hand, with faster landing pages delivering better ROI.”
Google equates low speed scores to a “huge missed opportunity”, since when users encounter slow websites “they’re much less likely to find what they are looking for or purchase from you in the future.” For agencies, developers, and site-owners, avoiding this “missed opportunity” could be the difference between winning or losing over your competitors.
Google launched Core Web Vitals to further elevate user experience, with a focus on measuring real human experience. In conjunction with the already existing search signals, Core Web Vitals make up the page experience ranking factor, using a more nuanced and multi-faceted approach. Once we deep dive into the three metrics, you’ll begin to understand why Core Web Vitals were incorporated into the ranking algorithms in the first place.
How does Google use Core Web Vitals?
Let’s get to know each of the Core Web Vitals a little more intimately.
Largest Contentful Paint (LCP)
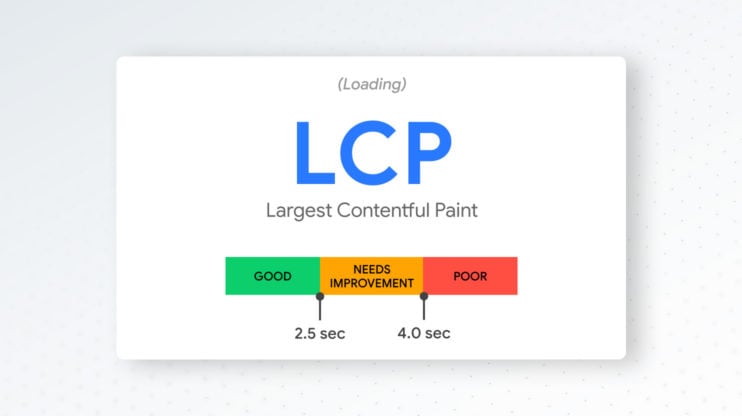
Largest Contentful Paint (LCP) approximates the loading time of a page by measuring the length of time it takes for the largest element on a page above the fold to fully appear. What are some examples of the largest elements found in a viewport? It can be an image, video, banner, background, or even block-level text.
LCP is calculated in a number of different ways—both in the field (Real User Monitoring) or in the lab (synthetic). Field tools include Chrome User Experience Report, PageSpeed Insights, Search Console, and Javascript Library. Lab tools to measure LCP include Chrome DevTools, Lighthouse, and WebPage Test.
A good LCP score is achieved when the largest element loads in 2.5 seconds or less, and this must be the case 75% of the time. When the load time is between 2.5 and 4 seconds, the LCP is considered to be in need of improvement, and when the load time is more than 4 seconds, the LCP is considered to be poor.
LCP is affected by:
- Slow server response times: LCP is directly impacted by the length of time it takes a browser to receive content from the server.
- Render-blocking JavaScript and CSS: These are files that prevent websites from presenting a web page until they have been loaded, delaying LCP.
- Resource load times: The length of time it takes to load resources such as images, videos, etc., can also affect LCP.
- Client-side rendering: When building a site mostly rendered on the client, a large JavaScript bundle that has not been optimized can negatively impact LCP.
In addition to addressing the above common issues, simple changes that can also improve LCP include optimizing images, reducing WebFont size, minifying CSS files, and applying instant loading with PRPL.
First Input Delay (FID)

First Input Delay (FID) focuses on the interactivity or responsiveness of your website. It does this by measuring the time it takes a page to process a user’s input (clicking a button, using the search field, etc.). It is important to note that FID is not about the loading time of the visual representation of the action, but rather, the response time after the action is taken. It applies to the initial action taken, emphasizing the “first impression” experience of your website.
Unlike LCP, FID cannot really be measured in a lab as it is dependent on human interaction with a page, or real user data. FID can be measured using field tools, including Chrome User Experience Report, PageSpeed Insights, Search Console, and JavaScript Library. Additionally, Lighthouse can also be used, even though it is a lab metric tool. The reason being that the lab metric Total Blocking Time (TBT) strongly correlates to FID, and can be measured via a Lighthouse performance audit on a website. The audit’s suggested improvements for TBT are applicable to FID improvement.
The goal metric for FID is 100 milliseconds or less, 75% of the time. If the delay time is between 100 to 300 milliseconds, the FID needs improvement, and when it is higher than 300 milliseconds, the FID is considered poor.
FID is affected by:
- Heavy JavaScript execution: Your browser will be delayed in responding to user actions when it is busy executing heavy JavaScript on the main thread.
Other changes that can be implemented to improve FID include minimizing main thread work, reducing the impact of problematic third-party scripts on the main thread, and keeping transfer sizes small.
Cumulative Layout Shift (CLS)
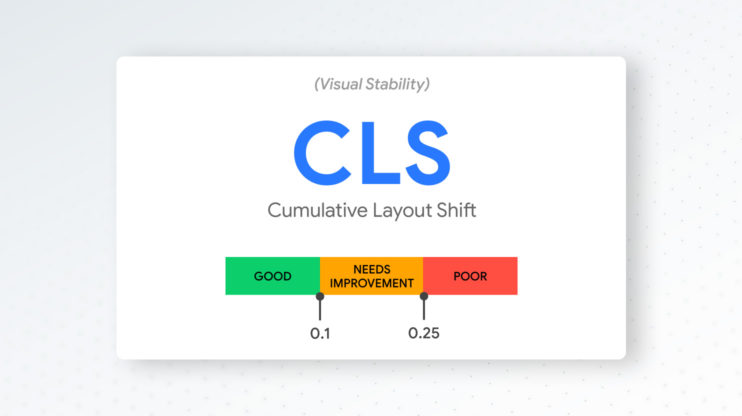
Cumulative Layout Shift (CLS) measures the visual stability of your website. It focuses on the largest burst of layout shift scores for every layout shift that takes place during the entire lifespan of a page, not caused by a user interaction. Good visual stability is considered to be a website in which nothing about the layout shifts unexpectedly—only as a response to an action taken by a user. The layout shift score is calculated by looking at the product of the impact fraction (the measurement of impact of unstable elements on the viewport area both before and after), and the distance fraction (the measurement of distance that the unstable elements have moved relative to the viewport).
Layout shift score = impact fraction x distance fraction
Like LCP, CLS can be measured using both field and lab tools. However, it is important to note that CLS values reported in lab environments may be less than when compared to real user experience. The reason being that the former is a synthetic environment that can only measure layout shifts that occur during the initial page load rather than the entire lifespan of the page, the latter being the true essence of CLS. The field tools include Chrome User Experience Report, PageSpeed Insights, Search Console, and JavaScript Library. The lab tools include Chrome DevTools, Lighthouse, and WebPageTest.
A website should have a CLS score of 0.1 or less, 75% of the time. A CLS between 0.1 and 0.25 is in need of improvement, while a CLS above 0.25 is considered poor.
The good news about CLS is that for most websites, following a few simple guidelines will help avoid any unexpected layout shifts. These include:
- Create static spaces for ads: As ads can be dynamic, style the element or reserve the slot size to reduce shifts.
- Featuring size attributes on all images and videos: Including width and height. dimensions on these elements ensures that the appropriate amount of space is allocated by the browser, avoiding any shifts.
- Not inserting content above existing content: By only inserting content into an existing element when it is in response to an action taken by the user, you can avoid unexpected shifts in layout.
- Utilizing transform animations: CSS transform property enables an animation of elements without causing layout shifts.
Other changes include using a placeholder for embeds and using preloaded fonts.
General solutions
Here I will provide a general checklist for website optimization to improve these metrics and fasten your website loading speed. You can rely on them while developing your website in an early stage, or apply them to an existing website. The whole meaning of optimization is to load only what is necessary, cache everything that you can, and serve files in the most efficient way.
Let’s start from the images:
Images
- Check used image formats (use PNG, BMP, GIF only if you really need to)
- Different sized images for different screen resolutions
- Optimize your images
- Serve WebP images to browsers that support them
- Use CDN to serve them faster
These are the steps to improve image loading, but even if they are all complete and you have small-sized images, you can still face a big network payload, slow website, and low score because of a large amount of them. So here a technique named “Lazy Loading” comes in handy.
Lazy Loading
To understand lazy loading, let me introduce you to its opposite technique called “Eager Loading”, which is usually used by default. Eager Loading means that all resources on the webpage (images, videos, music, etc.) load before the webpage loads. So, if we have a large blog post with a hundred images, we will load them all, and then mark the webpage as loaded. When using lazy loading, we load web pages without resources and load them only when they are required. In our example of a blog post with a hundred images, we will render the page without images and load them one by one only when the user scrolls to them. There are many popular ready-to-use libraries for it, or you can use Browser-level lazy-loading. So, what we’ve got here:
- Use lazy-loading to improve loading speed
- Lazy-load images
- Lazy-load videos
- Lazy-load iframes
- Use lazysizes to lazy-load images
CSS
The next one will be CSS optimization. The CSS files are render-blocking resources, which means that they must be loaded and processed before the browser renders the page, so their optimization has a huge impact on website loading speed and score.
The cornerstone of CSS optimization is to split your CSS rules into two categories: critical and non-critical—and load the critical parts sooner. Critical CSS are CSS rules that are crucial and used to render the “visible” content. Non-critical CSS rules are any other CSS rules. There are many tools that will help you extract Critical CSS rules, for example, Critical, criticalCSS, or Penthouse. Each one of them will extract Critical CSS from your CSS, a good practice is to put Critical CSS rules inline in <style> tag, and load uncritical CSS in a separate file using <link> tag after the page load. Let’s add them to our checklist:
- Extract Critical CSS
- Defer non-critical CSS
- Minify CSS
- Optimize background images with media queries
- Use font:swap rule for displaying text content immediately
JavaScript
Optimization of JavaScript is as important as CSS optimizations, and is much more complicated. In general, all you need is to follow the PRPL pattern:
- Push (or preload) the most important resources
- Render the initial route as soon as possible
- Pre-cache remaining assets
- Lazy-load other routes and non-critical assets
Let’s add this and other actions to our checklist:
- Use PRPL pattern
- Reduce JavaScript payloads with code splitting
- Minify and compress network payloads
- Use Modern JavaScript
- Remove unused code and libraries from your web application
Our solution
Our plugin does almost everything described above and even more. These are the two most valuable changes that we made to achieve a general solution for almost every website: loading resources via WebWorker and a near-to-perfect Critical CSS generator.
WebWorker is a JavaScript (not necessarily, hello WebAssembly👋) program that runs in a separate thread of the browser and doesn’t block the main thread, which leads to faster page render. We collect all the CSS and JS files on the backend, remove them from the page, and provide links to our WebWorker script, which fetches them and connects them to the page on user interaction. Critical CSS in that case helps to achieve a well-rendered page with minimal CLS and faster FCP. And that’s how we achieve that incredible score!
Website optimization
As mentioned earlier, the reasoning behind Google’s roll out of Core Web Vitals is nothing new—it’s simply a continued effort of rewarding websites that are optimized to enhance user experience. Whether you are looking at the Largest Contentful Paint, First Input Delay, or Cumulative Layout Shift, they are all simply distinct factors with a shared overall goal: providing a great user experience on the web. Just look at the words used to describe each Core Web Vital: loading, interactivity or responsiveness, and visual stability, all of which are dependent on a website being optimized. While Core Web Vitals have been put in place by Google to measure the quality of user experience on a site, they will continue to evolve, and future changes and additions should be expected. All that remains constant is the emphasis on a website’s continual optimization.
Choosing a hosting provider that prioritizes getting your website to reach its highest potential in terms of Google rankings is key. At 10Web, automated optimization is an ingrained aspect of our platform, meaning we take care of all the technicalities for you. The 10Web Speed Optimizer, an ever-improving tool, is automatically installed and utilized when you host a website on our platform. As speed remains the priority in Google algorithms, we make sure all websites hosted at 10Web receive an automatic 90+ PageSpeed score. The added bonus? The ways in which we ensure this incredible speed score, as well as our other updates, are already in line with good Core Web Vitals values. Here are just a few examples of this win-win situation:
- Image Optimization: The automatic optimization of images that 10Web provides helps load images fast (while retaining high resolution), improving LCP time.
- Lazy Loading: 10Web’s Speed Optimizer allows you to lazy load images, background images, iFrames, and videos. Enabling lazy loading results in the chosen elements only loading when a user scrolls down the page, helping to achieve a better LCP value.
- Preloaded Videos: An update we implemented last year is the option to preload videos, which downloads and caches the data, making your page load faster.
- Caching: 10Web includes a powerful caching structure as part of our hosting service, using one of the fastest caching layers (Nginx FastCGI), and allows you to control what pages get cached. This not only impacts LCP, but also FID.
- Minifying JavaScript: Minifying JavaScript helps reduce overall page loading time and is also key in improving FID by allowing users to actually interact with your page.
- Delaying All JavaScript: A recent update to our Speed Optimizer allows the option to delay all JavaScript code execution before an interaction has been made, improving page speed score and specifically FID.
- Compressing CSS files: Minifying bulky CSS can help speed up LCP times.
- Critical CSS Generation: splitting CSS to critical and uncritical and load it in that sequence.
- Set Dimensions: Finally, our popular Photo Gallery plugin allows you to set maximum width and height dimensions for media, to ensure best loading speed and a good CLS value as the properties won’t change as the page fully loads.
Whether you are hosting your website with 10Web, or migrating an already existing one to our platform, see what automated optimization can do for you! Start your free trial with 10Web today and take your website to the next level.
FAQs
Google will continue to evolve the metrics it uses to measure user experience, but as noted above, the overall goal remains the same. That being said, let’s take a look (and answer!) some of your frequently asked questions about Core Web Vitals.
- What is the difference between Core Web Vitals and PageSpeed Score?
Generally speaking, they are almost the same. With PageSpeed Score you don’t need to worry about the technical aspects. It is easier to understand, measure, and even remedy, as it is a single number from 0 to 100, and we know that if the number is 90+, everything is fine. Improvements made to PageSpeed Score will also improve the values for Core Web Vitals as they have the same shared goal of optimizing user experience.
- Why does 10Web promise a 90+ PageSpeed Score if it’s not important anymore?
It is very important, and we are so proud to continue offering a 90+ PageSpeed Score! Google solidified the importance of a good PageSpeed Score of 90 or above, and when you look at all the different components that enable our ability to provide a 90+ score, you’ll see they are also important components in regards to Core Web Vitals. If your site has the 90+ PageSpeed Score, it will improve the CLS and FID values, bettering your Core Web Vitals values.
- I only have 10Web plugins, such as Photo Gallery, Image Optimizer, etc., can I still have a 90+ Page Speed Score?
We cannot guarantee a 90+ PageSpeedScore through our plugins alone. While the plugins such as Photo Gallery and Image Optimizer do contribute to a faster and more optimized website, they are still just pieces of the overall puzzle. For a guaranteed 90+ PageSpeed Score, make sure to move to the 10Web platform!
Want to speed up your website instantly?
Speed up your website automatically
Get 90+ PageSpeed Score automatically with 10Web Booster. On any hosting!

Speed up your website instantly
Speed up your website instantly
-
 Automatically get 90+ PageSpeed score
 -
Experience full website caching
-
Pass Core Web Vitals with ease
 Automatically get 90+ PageSpeed score